What is LaseView ?
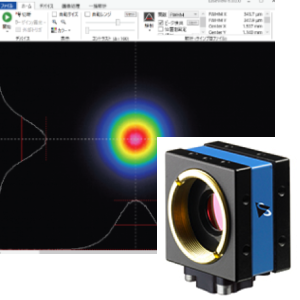
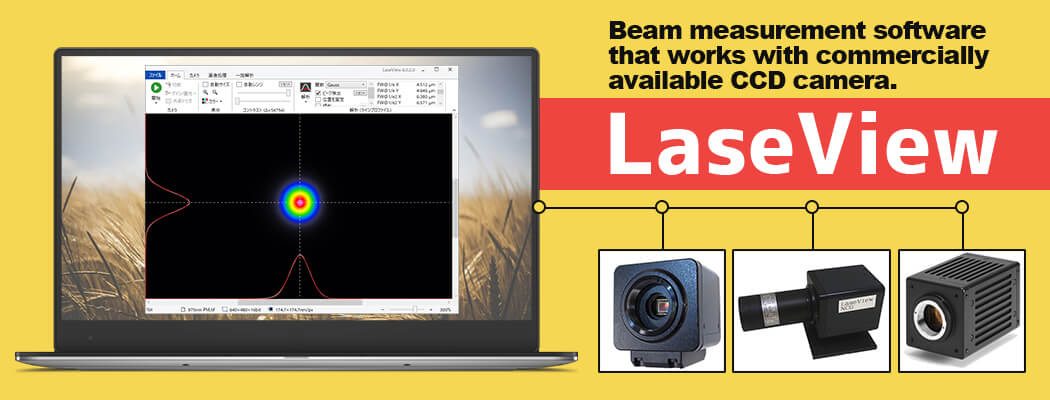
“Beam profiler with M2 platform software “LaseView” is a highly functional and versatile laser beam profiler software that allows to use commercially available CCD cameras as beam profilers.
By using commercially available CCD and CMOS cameras, it is easy to build an extremely low-cost and practical beam measurement system.”
Features
- Easy measurement of beam profile and beam diameter.
- Low cost commercial available cameras can be used
▶︎ possible to build low cost beam monitoring system. - Measurement of M2 beam quality.
- Measurement of beam divergence.
▶︎ Measurement of propagation loss. - Measurement of temporal beam pointing changes.
▶︎ Measurement of beam stability. - Save images at set time intervals (image logging).
- Free evaluation version is available.
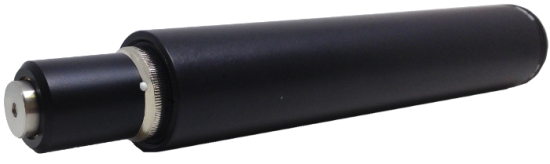
- Micro-beam (from 2 μm) measurement set is available for measurements.
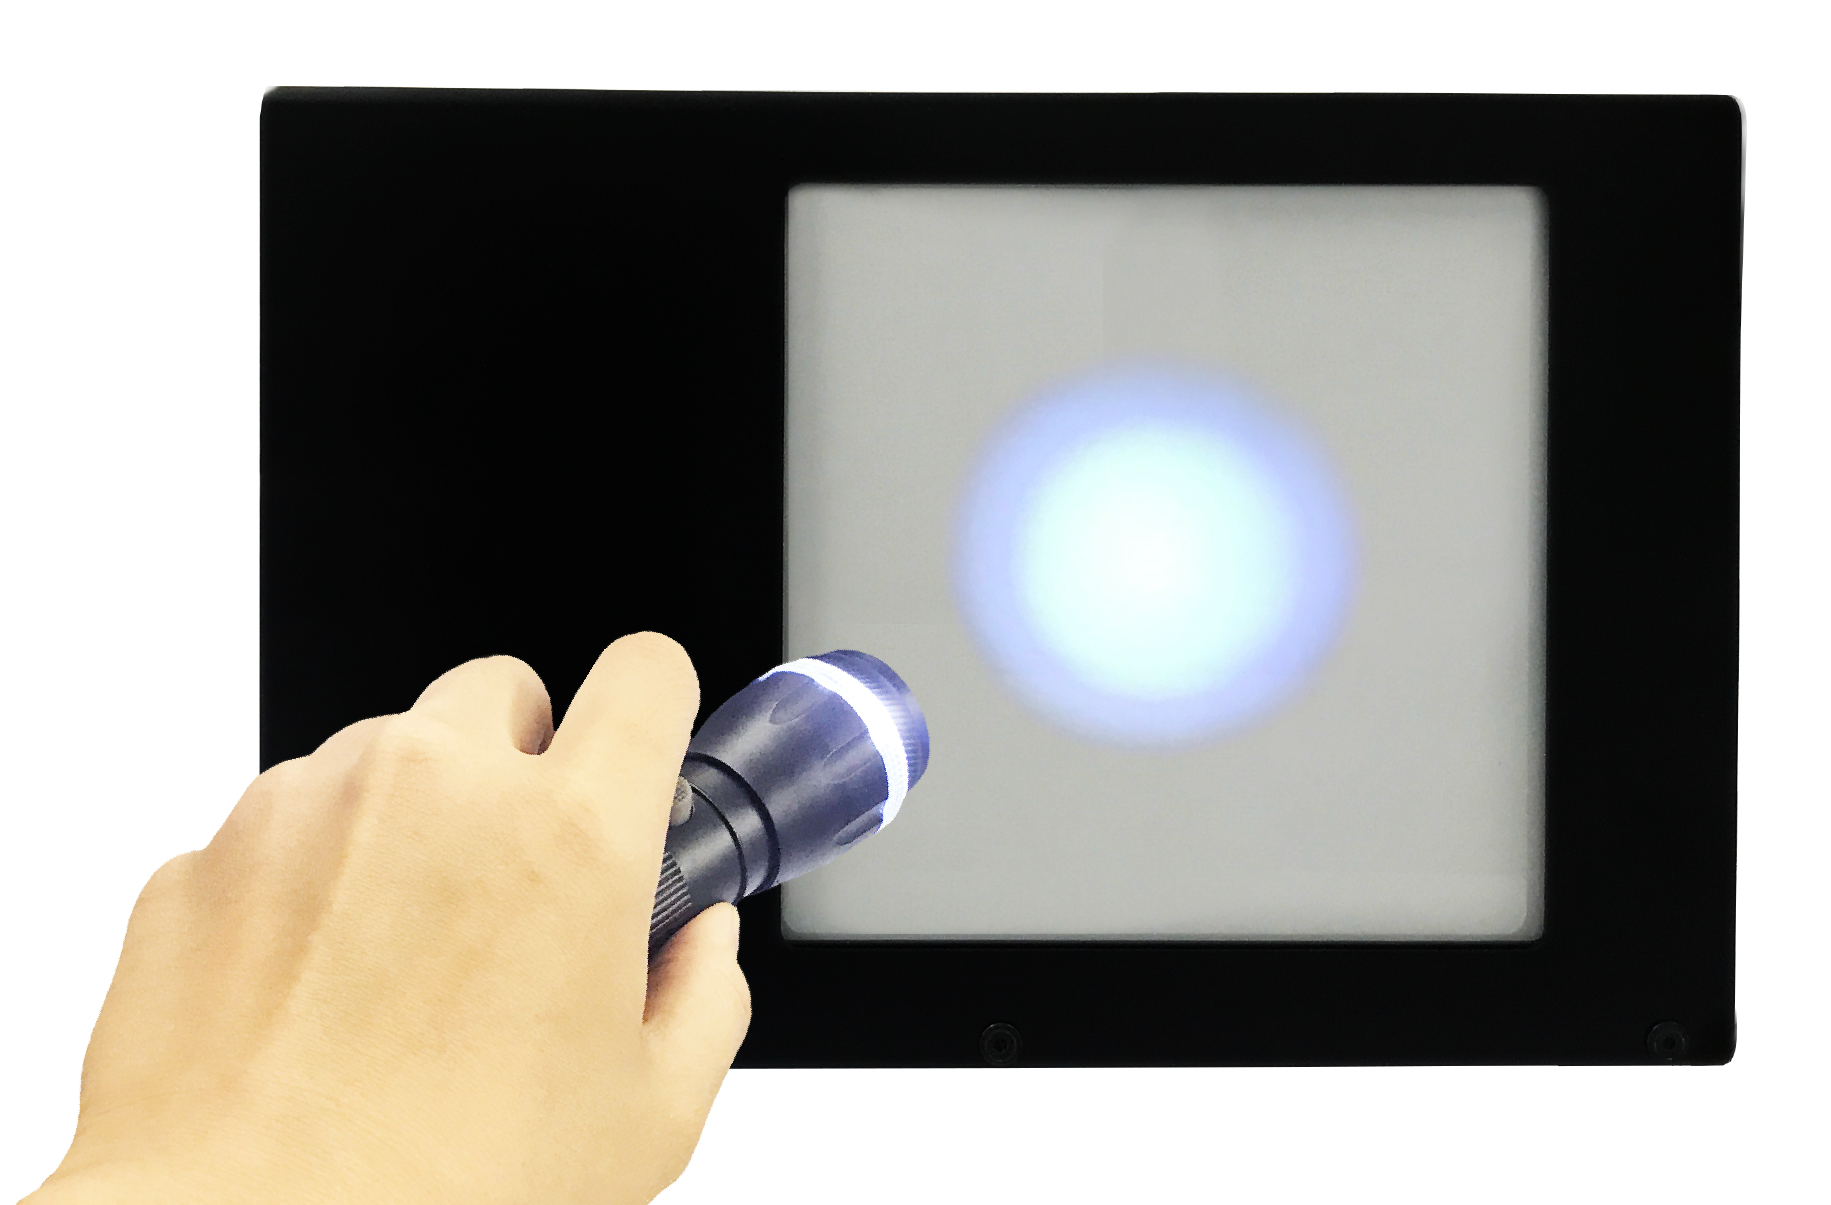
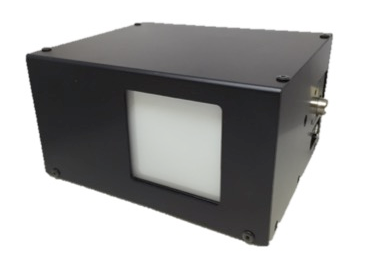
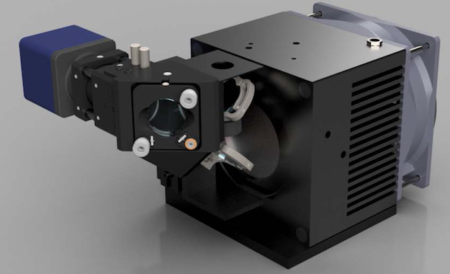
- Beam profiler for large apertures (up to 200 mm) and high power.
- One software license for one computer
- Multiple cameras can be connected to a single software
Price
| version | Product name | Price (Excluding tax) |
Delivery date | User’s manual |
|---|---|---|---|---|
| Evaluation (7 days) |
LaseView Subscription 7-day Evaluation | Free of charge | Immediately |
|
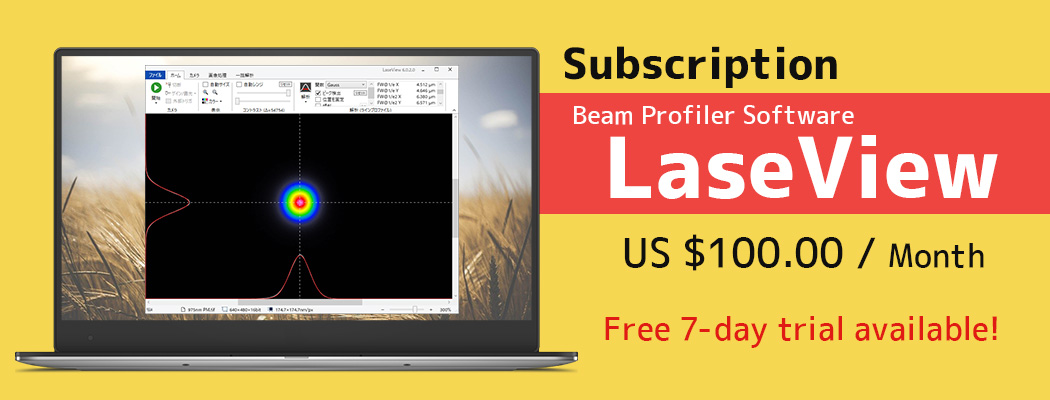
| Commercial | LaseView Subscription | US $100 / month | Immediately |
|
| Commercial | LaseView Permanent License | US $3,300 | Immediately |
Details
*At least a camera is required to measure the beam profile. Please see the “recommended cameras“.
*If the beam intensity is too strong or the beam diameter is too small, please see the “Other options“.
*For large beam diameters, please see “Beam profiler for large aperture and high power“.
*If the image does not appear when the start button is pressed, set the camera settings in the [Pixel Format] of the [Camera Settings] tab before starting.
Features
- Ribbon UI User Interface
- Image Logging Function
- Analysis of temporal beam pointing change
- Beam divergent angle analysis
- Histogram Display
- Measure spatial intensity distribution of the beam
- Measurement of beam diameter
- Measurement of M2
- Measurement of small beam sizes below 30 μm
- Real-time image averaging
- Real-time contrast adjustment(wide dynamic range of 16 bit, 65536 shades)
- Image buffer function (images can be stored in memory and displayed sequentially)
- Image saving function in TIFF format
- Smooth display with hardware acceleration
- Support for 32 bit and 64 bit Windows
System Requirements
Windows 8.1, Windows 10, Windows 11
CPU speed: Intel Core i3 2GHz or equivalent or higher
Free memory: 512MB or more
*However, we do not guarantee the operation of all computers that meet this environment.
*NET Framework 4.5 or higher is required to run this software.
You can check the version of .NET Framework version from the following link:
http://msdn.microsoft.com/ja-jp/library/hh925568(v=vs.110).aspx
*Depending on the version, the actual screen may differ from the screen in this manual, but it can be used without problems.”
Analysis function
- Line profile
Crosshair line profile display with Gauss, Lorentz and Sech function fitting and FWHM analysis - Integration Profile
Display of horizontally and vertically averaged profiles (with the same analysis functions as the line profile) - Maximum value projection profile (Max. Intensity Projection)
Display of horizontally and vertically averaged (maximum) projection profile
(with analysis function similar to line profile) - Point-to-Point Distance
Measure the distance between any two points on the screen. - Peak Integration
Analyzes the integrated value inside the circle and the light intensity on the cursor with the outside of the circle as background.
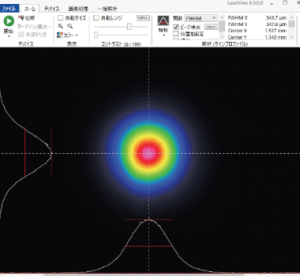
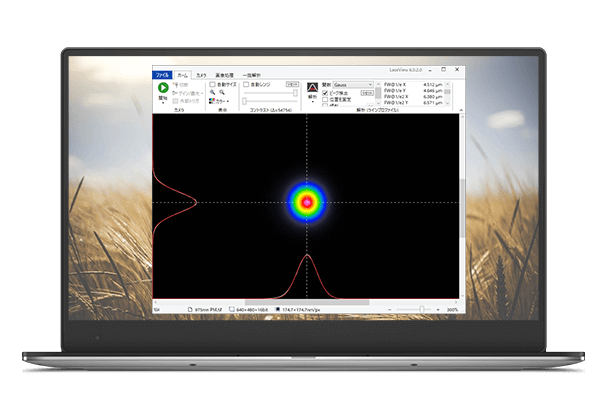
Example of analysis
Displays the line profile on the crosshairs (white line). The FWHM of the beam profile can be calculated and fitted with Gauss, Lorentz, and Sech functions. The crosshairs can also be rotated (the red line is the result fitted with the Sech2 function).

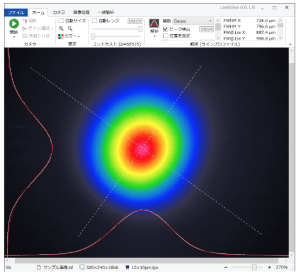
Displays a profile averaged in the horizontal/vertical direction. The same analysis functions as the line profile can be used.
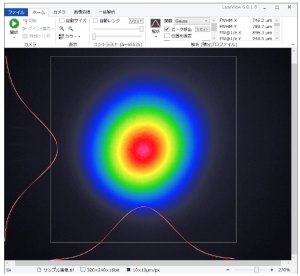
Displays only the profile of the horizontal/vertical orthographic projection (maximum value). The same analysis functions as for line profiles can be used. In the figure, the FWHM is measured.
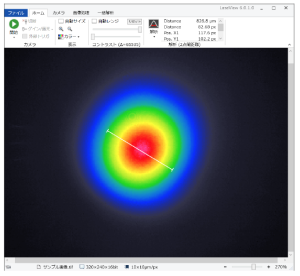
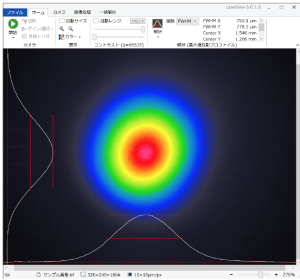
It is possible to measure the distance between any two points on the screen. In the figure below, you can see that the diameter of the profile shown in green is 826.8 μm.
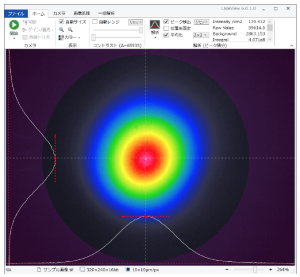
This function analyzes the integral value in the park with the outside of the circle as background. Adjust the position and size of the circle that appears on the screen so that the beam is well within the circle. When the ” Peak Detection” is clicked as shown in the figure below, the peak position will be indicated by the crosshair cursor.
Description of the notation
A description of the notation used in each function is shown in the table below.
| Function | Notation | Description |
|---|---|---|
| Line profiles Integral Profiles Maximum value projection profile |
FWHM X | Horizontal full width at half maximum |
| FWHM Y | Vertical full width at half maximum | |
| FW@1/e X | Full width at 1/e in horizontal direction | |
| FW@1/e Y | Full width at 1/e in vertical direction | |
| FW@1/e2 X | Full width at 1/(e×e) in horizontal direction | |
| FW@1/e2 Y | Full width at 1/(e×e) in vertical direction | |
| Center X | Horizontal center position | |
| Center Y | Vertical center position | |
| Height X | Horizontal peak height | |
| Height Y | Vertical peak height | |
| Position X | Horizontal cursor position | |
| Position Y | Vertical cursor position | |
| Integration Profile | Max X | Maximum value of horizontal signal strength |
| Min X | Minimum value of horizontal signal strength | |
| Max Y | Maximum value of vertical signal strength | |
| Min Y | Minimum value of vertical signal strength | |
| Point-to-Point Distance | Distance | Distance between two points (m) |
| Distance | Distance between two points (pixels) | |
| Pos. X1 | X-coordinate of the first point | |
| Pos. Y1 | Y-coordinate of the first point | |
| Pos. X2 | X-coordinate of the second point | |
| Pos. Y2 | Y-coordinate of the second point | |
| Peak Integration | Intensity /cm2 | Intensity at the cursor position (in cm^-2) |
| Raw Value | Digital count value of Intensity value | |
| Background | Background signal intensity | |
| Integral | Integral with background subtraction | |
| Raw Integral | Integral value without background subtraction | |
| Position X | Horizontal cursor position | |
| Position Y | Vertical cursor position |
M2 beam quality analysis function
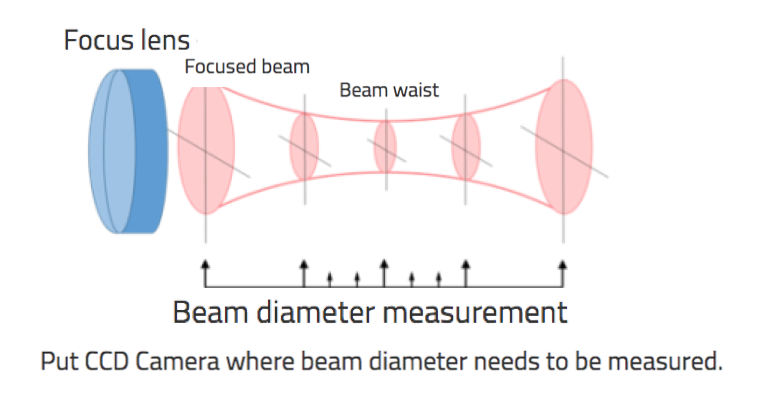
The procedure for setting up the optical system is shown below.
- Focus the laser beam using a lens with an F value (focal length/beam diameter) of about 50 to 100.
- Set up a ruler or optical rail so that the CCD camera can slide along the beam within ±50mm to ±150mm from the center of the beam waist.
- Adjust the incident light level and gain/exposure time so that the laser beam is not too strong.
The procedure for M2 beam quality analysis is shown below.
- Click “Open Folder” in the “File” tab and create (or specify) an empty folder to save the images.
- Save about 10 to 30 beam profiles on the axis of the laser beam, centered on the beam waist and ranging from ±50mm to ±150mm in front and behind. The procedure is as follows.
- Check the beam diameter at the beam waist.
- Move the CCD camera to a position where the beam diameter is about 5 times larger than the beam diameter at the beam waist.
- Fix the CCD camera and adjust the light intensity and CCD exposure time to obtain a good image with low noise.
- Click on “Save Image” in the “File” tab, enter the current CCD position in the file name text box (Please use single-byte character in China, Korea etc.), and save the image. At this time, the unit can be added after the number, such as nm, um, mm, cm, m. If the unit is omitted, the image will be processed as mm.
Example. 30mm.tif, 100mm.tif, 150mm.tif, etc. - The CCD camera is moved at intervals of 2 to 10 mm, and above step 3 to step 5 are repeated. In this case, the moving intervals do not have to be equal, and the accuracy may be improved by measuring the area around the beam waist at narrower intervals.
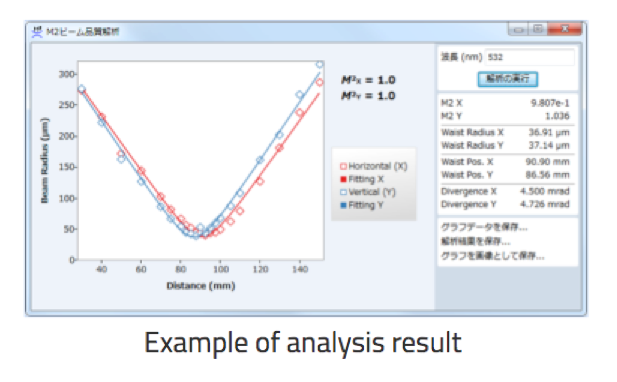
- Click the “M2 Beam Quality” button in the “Batch Analysis” tab, the M2 Beam Quality Analysis window will appear, and enter the laser wavelength in nm in the text box on the upper right.
- Click the “Run Analysis” button to run the analysis, and if successful, the results will be displayed in the graph.
*Analysis results are displayed as beam radius.
Beam divergence angle analysis
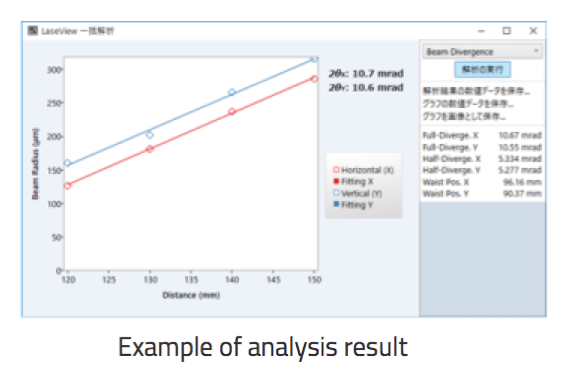
The procedure for beam divergence analysis is shown below.
- Click “Open Folder” in the “File” tab and create (or specify) an empty folder to save the images.
- Take measurements at two or more locations and save the images in the same folder. Include the measurement location in the file name. For example, 1.5 m, 25 cm, etc.
- “Click the [Spread Angle] button in the [Analyze] tab. The Batch Analysis window for the beam divergence angle appears.
- Click the [Run Analysis] button to run the analysis, and if successful, the results will be displayed in a graph.
Analysis function of temporal beam pointing changes
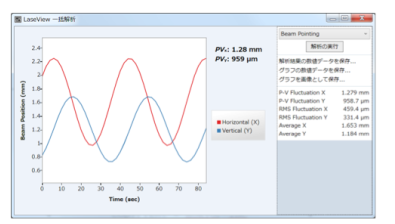
The following is the procedure for analyzing the temporal beam pointing change.
- Click “Open Folder” in the “File” tab and create (or specify) an empty folder to save the images.
- Use the image logging function to save the images at reasonable time intervals.
- Click the “Pointing” button.
- Click “Run Analysis” to display a graph of the timed changes in the X and Y coordinates of the beam center. The elapsed time is calculated based on the shooting date and time embedded in the file.
Comparison with conventional product
By using commercially available CCD and CMOS cameras, an extremely low-cost and practical beam measurement system can be easily built. In addition, the availability of low-cost cameras makes it possible to construct a beam monitoring system with multiple cameras at low cost.
| LaseView | Conventional products | |
|---|---|---|
| Customizability | ◎ | ✕ |
| Sales system | Software only (Supported Cameras) | Software license and camera |
| Use of third party cameras | ◎ (Supported Cameras) |
✕ |
| M2beam quality measurement Function | ◎※ As a standard |
✕ (Option USD 5,000〜) |
| Price (software) | USD 100 / month | ✕ |
| Price(camera) | from USD 1,441 needs software license |
from USD 5,000 |
| Price for 4 cameras (4 cameras) | from USD 5,764 needs software license |
from USD 20,000 |
| Beam Profiler +M2 beam quality measurement Function |
from USD 1,441 needs software license |
from USD 10,000 (USD 5,000+USD 5,000) |
| Minimum measurable Beam diameter | from 2 μm (When the micro-beam measurement set is installed) |
from 30 μm |
| Maximum measurable beam diameter | within 200 mm (Sold as beam profiler for large apertures and high power) |
within 24 mm |
| Maximum measurable power | within 600 W (Sold as 600 W Beam Profiler for Fiber laser) |
? |
| Languages | English captions are automatically shown if OS is not Japanese version | Fixed (English ?) |
Example of LaseView usage
Sample images
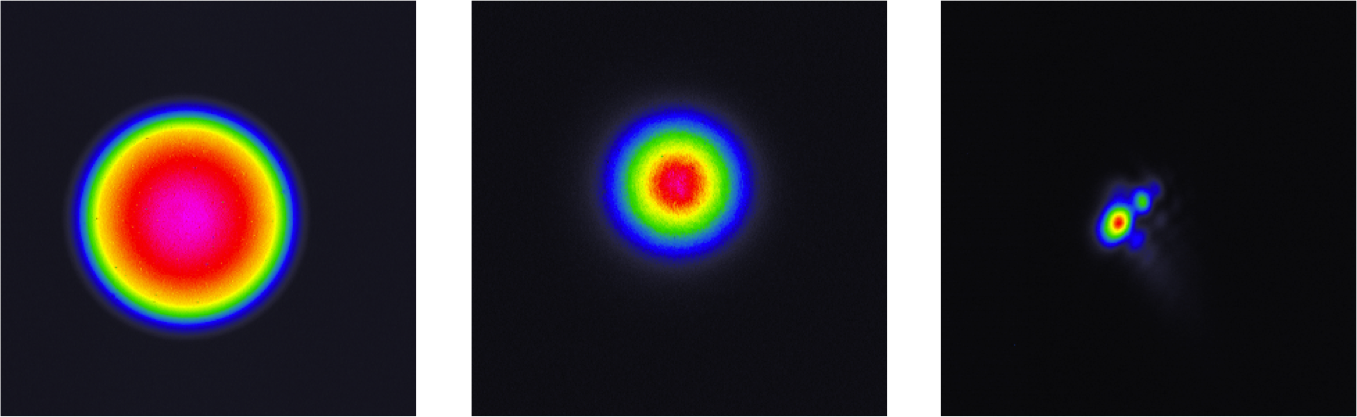
Fig. from left : near-field image of a He-Ne laser, far-field image of a Ti:Sapphire laser (focused by a parabolic reflector with f=3.3), and focused LD light output from a multimode fiber.
Laser beam position monitoring system for laser processing (1 software + 2 cameras)
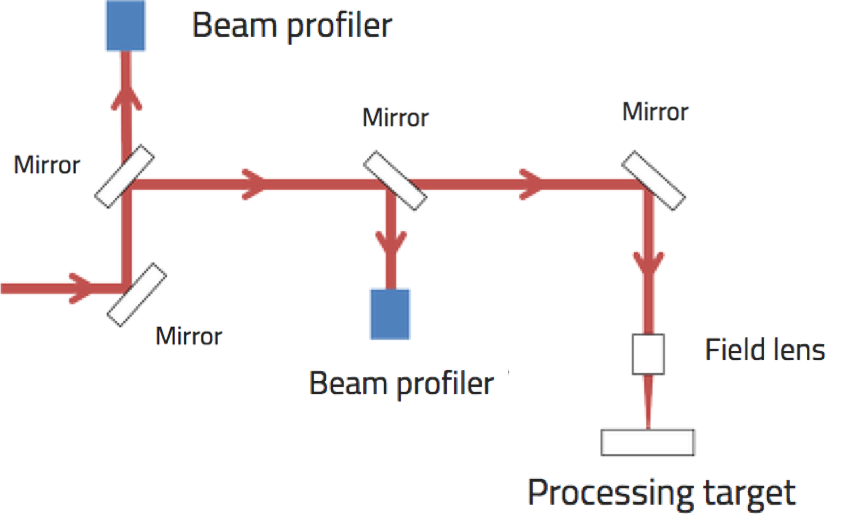
Fig. Monitoring the position of the laser beam during laser processing.
Laser beam monitoring system for laser processing (damage) testing (1 software + 4 cameras)
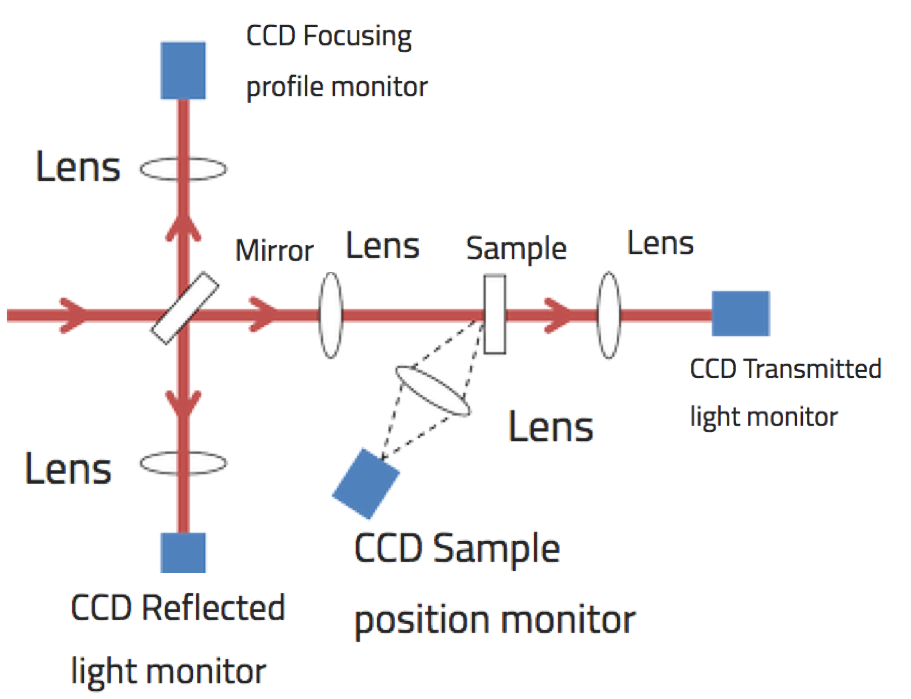
Fig. Measurement using multiple CCDs in a laser processing (damage) test.
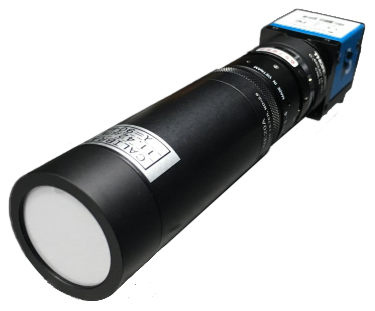
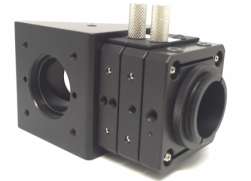
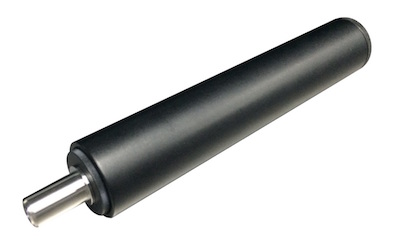
Optical microscope system
- Magnification: 10x, 20x, 40x (specify magnification when ordering)
- NA: 0.25 (10x), 0.40 (20x), 0.65 (40x)
- Wavelength range: 400 to 700 nm
- Working distance: 5.5 mm (10x), 1.7 mm (20x), 0.6 mm (40x)
- Length: approx. 180 mm
Optical microscope system
Optical microscope system
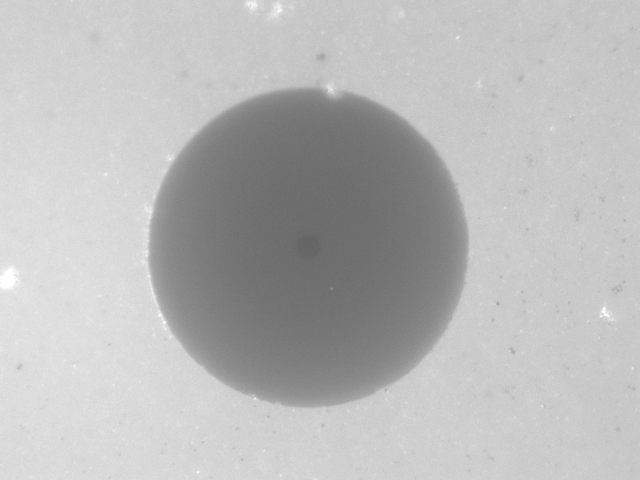
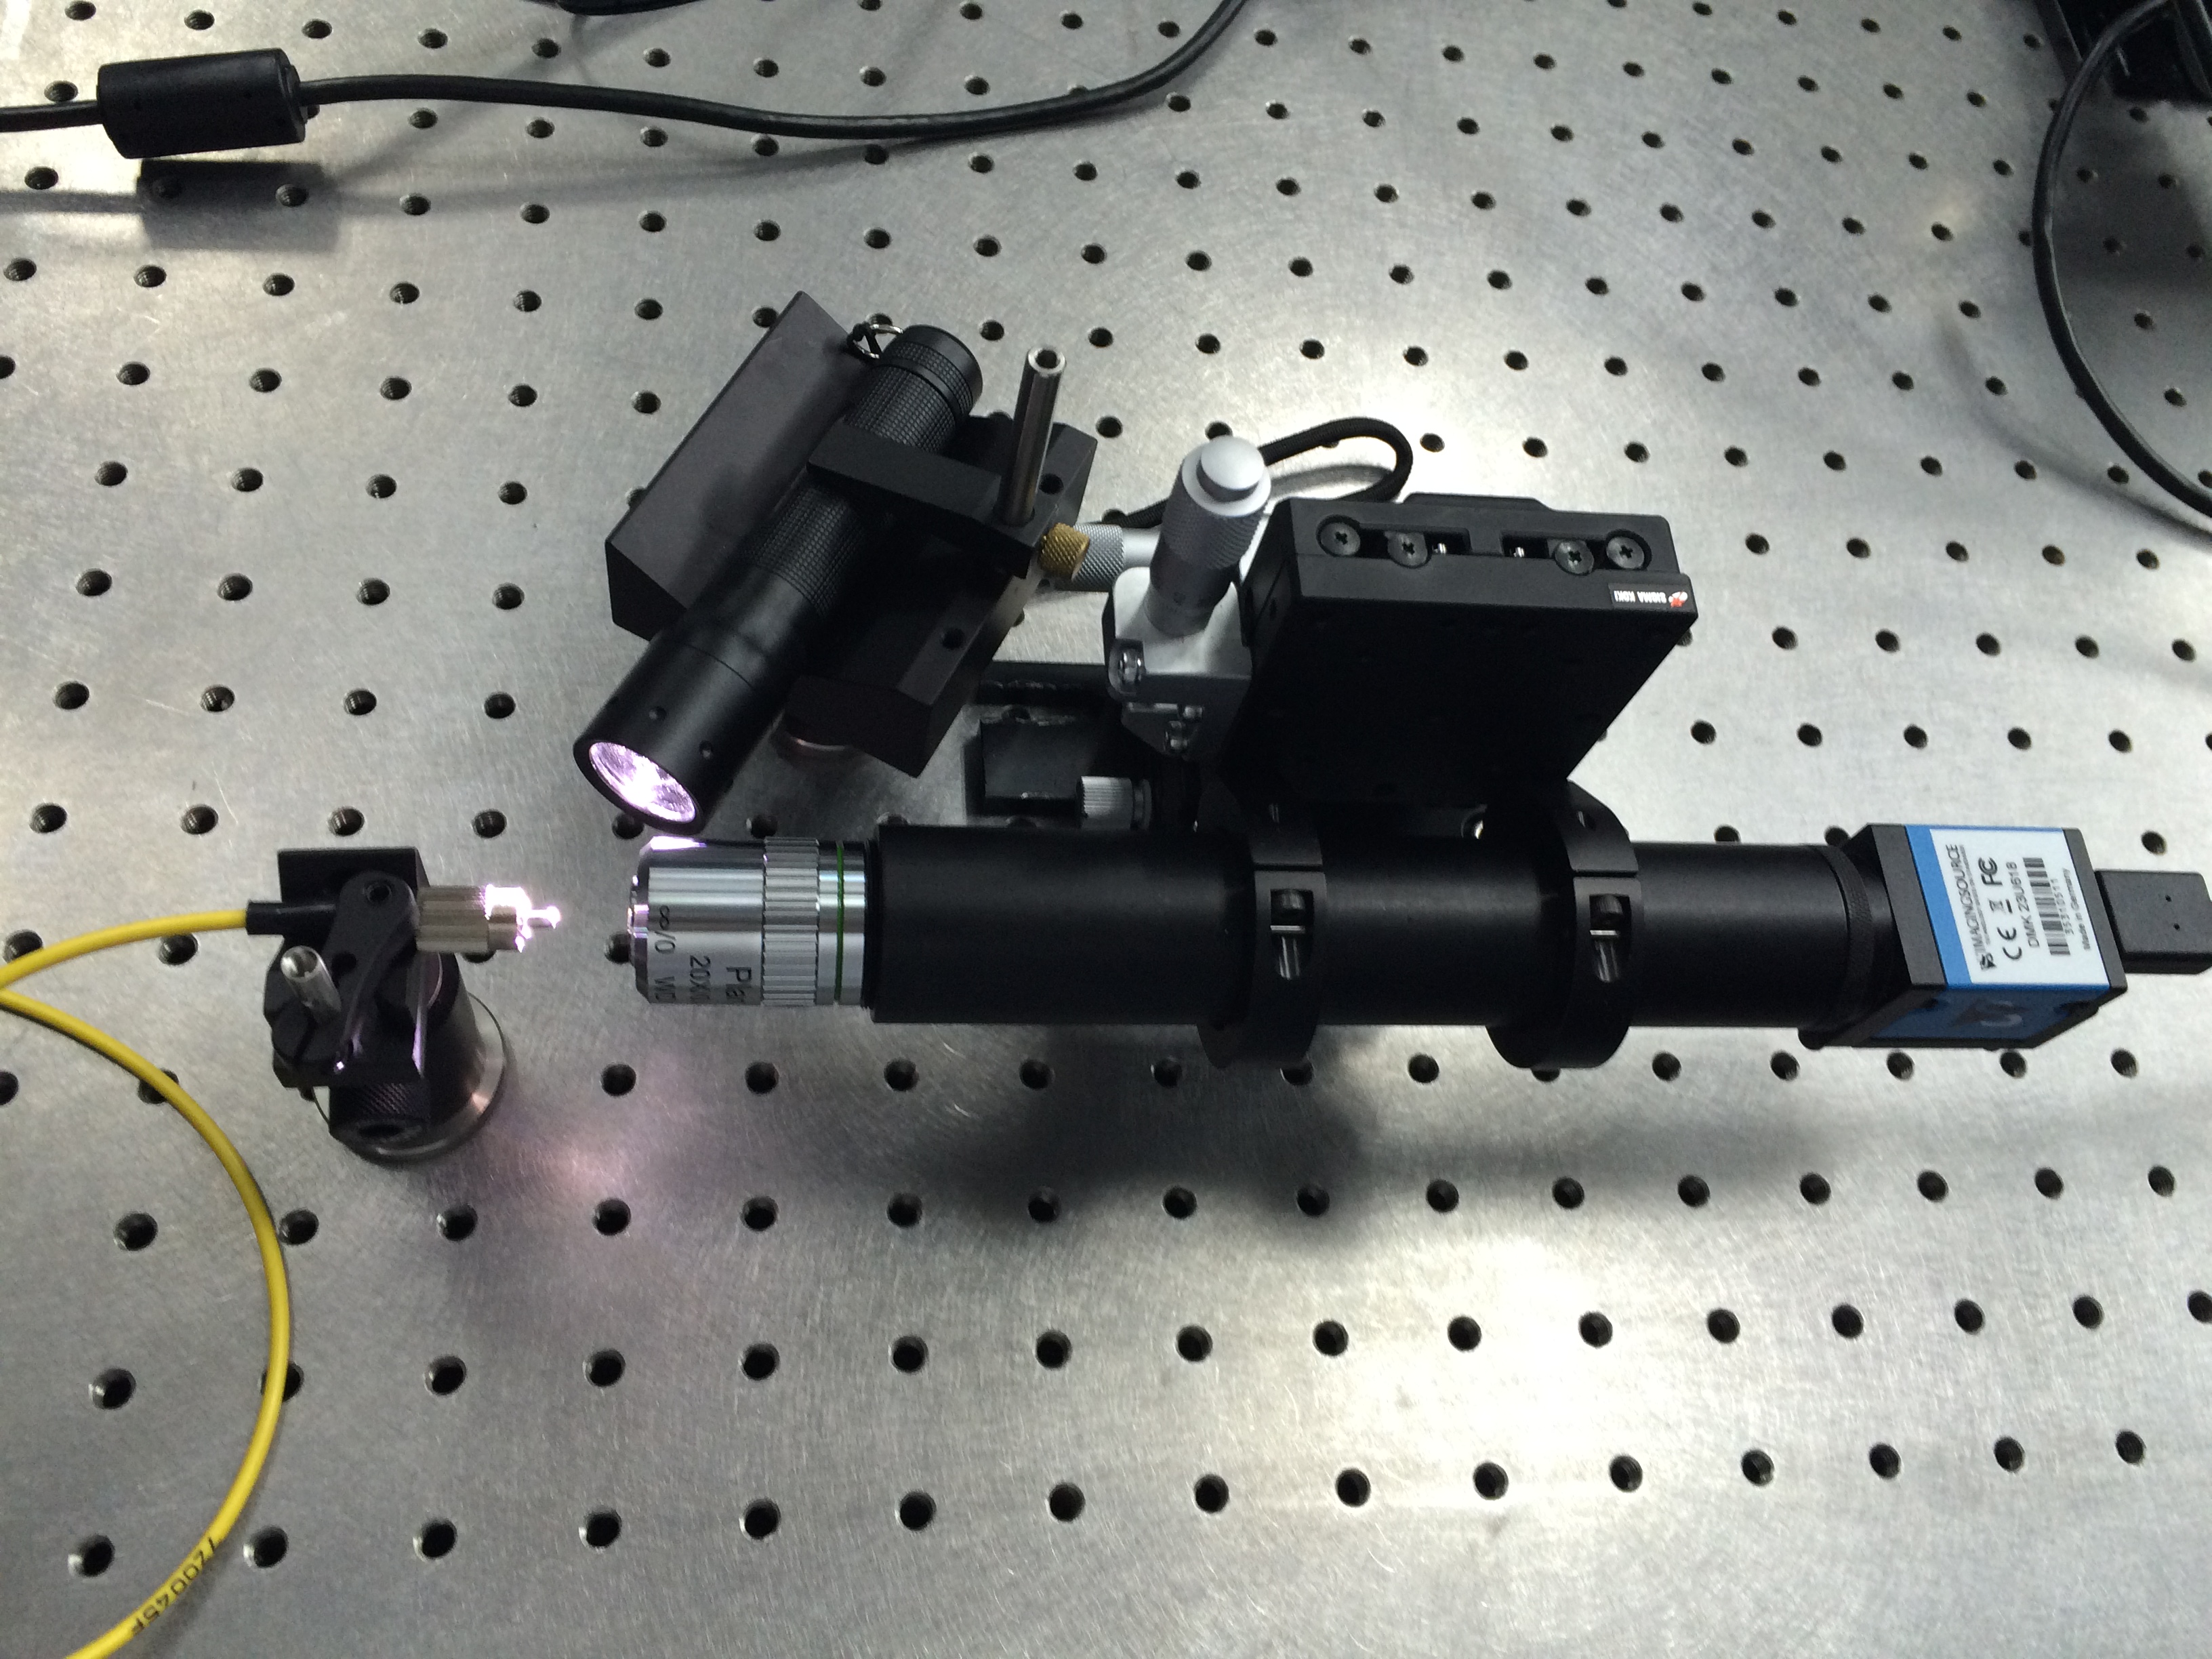
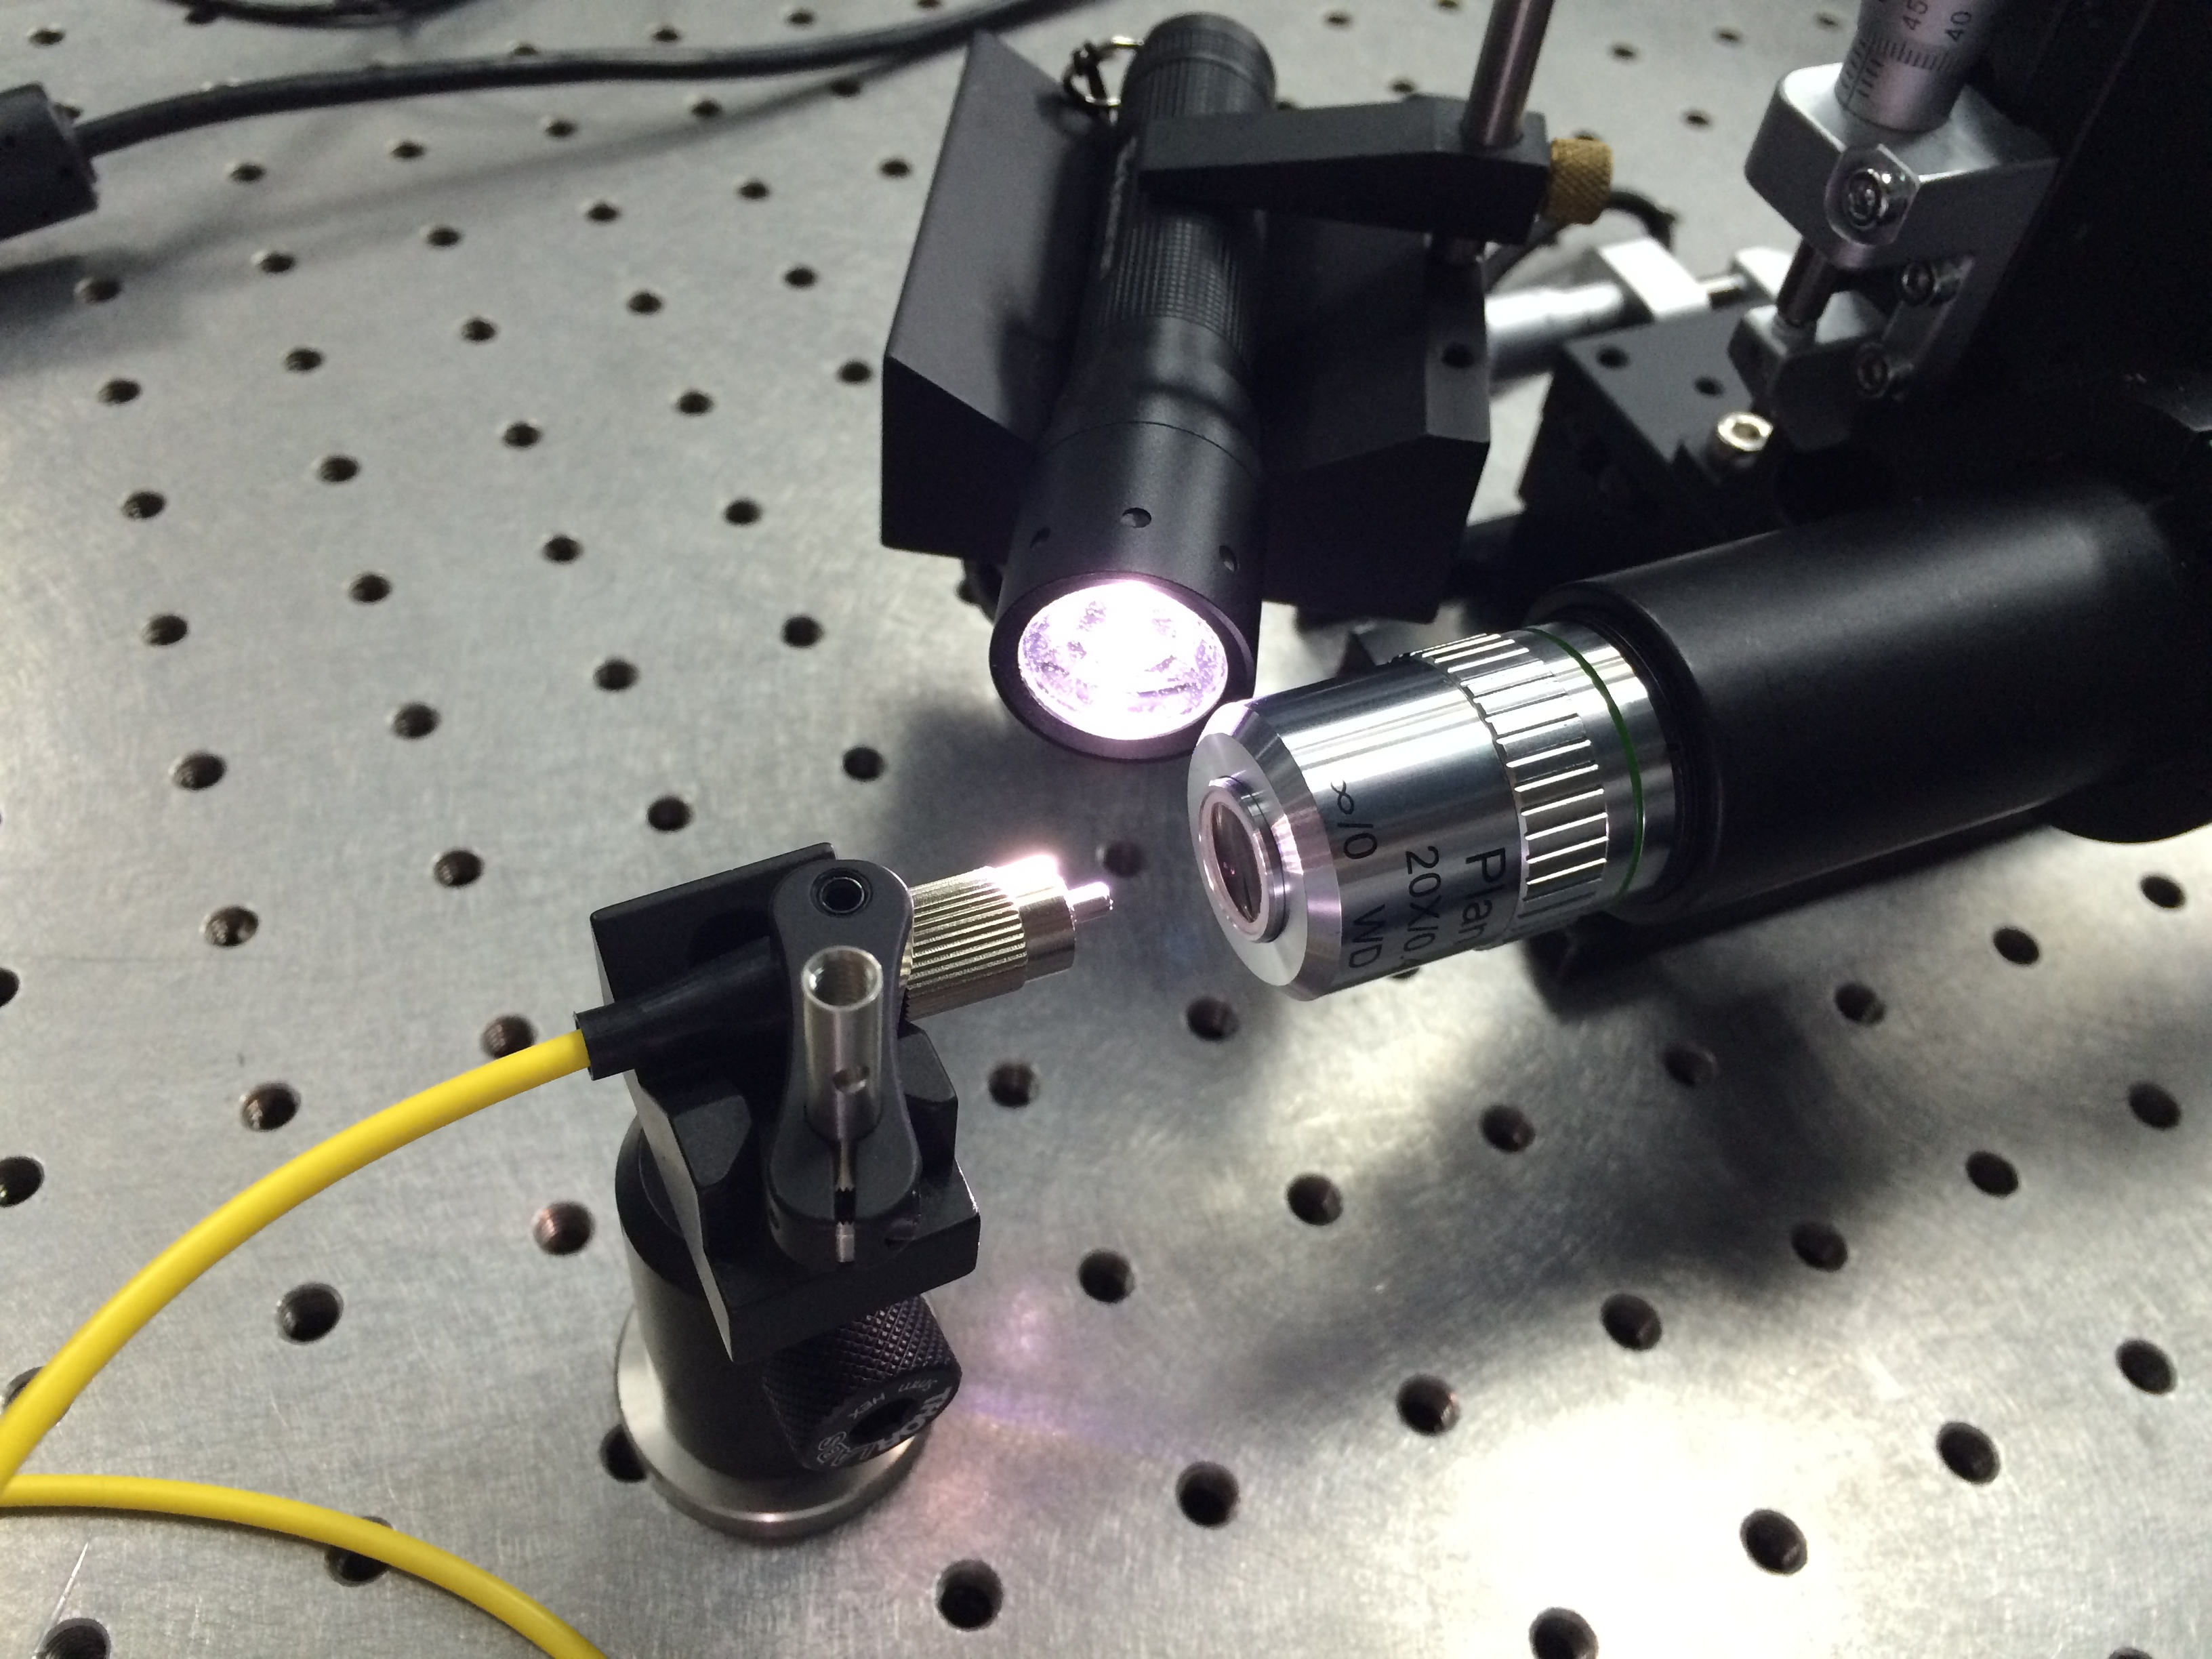
Fiber end facet (20x)
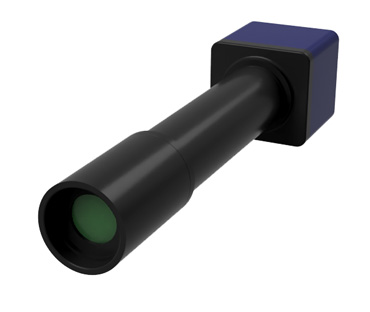
Optical fiber measurement system
- there is no damage on the end facet of the optical fiber.
- the mode field diameter of the optical fiber is known.
- the intensity distribution is Gaussian.
- the connector is diagonally polished.
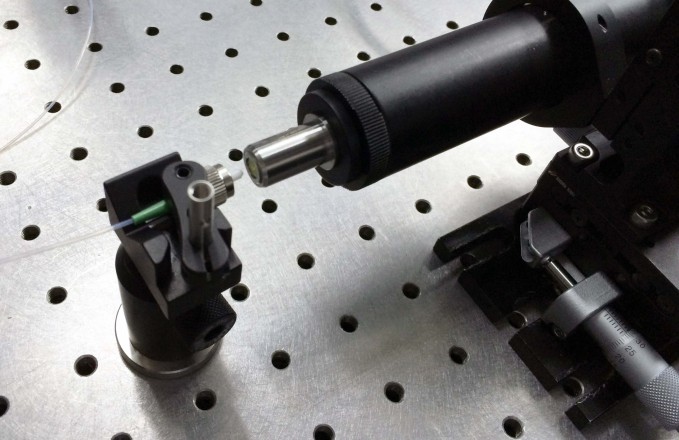
Optical fiber measurement system
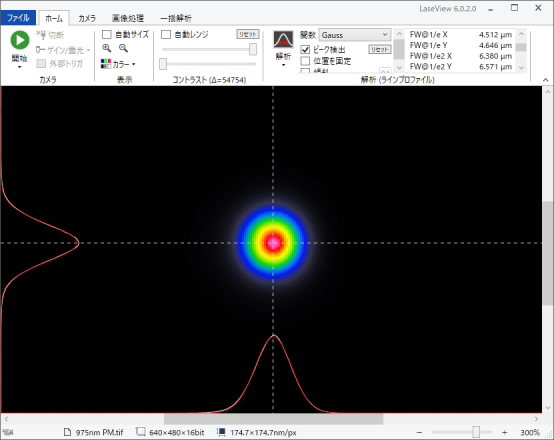
Example of beam profile emitted from fiber facet
Control and Evaluation System for Spatial Light Modulator (LCOS-SLM)

Control and Evaluation System for Spatial Light Modulator (LCOS-SLM) (Japanese)
LaseView’s multi-point analysis function
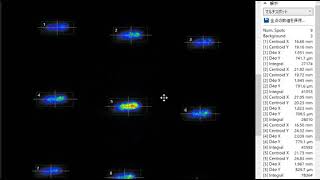
LaseView's multi-point analysis function (Japanese)
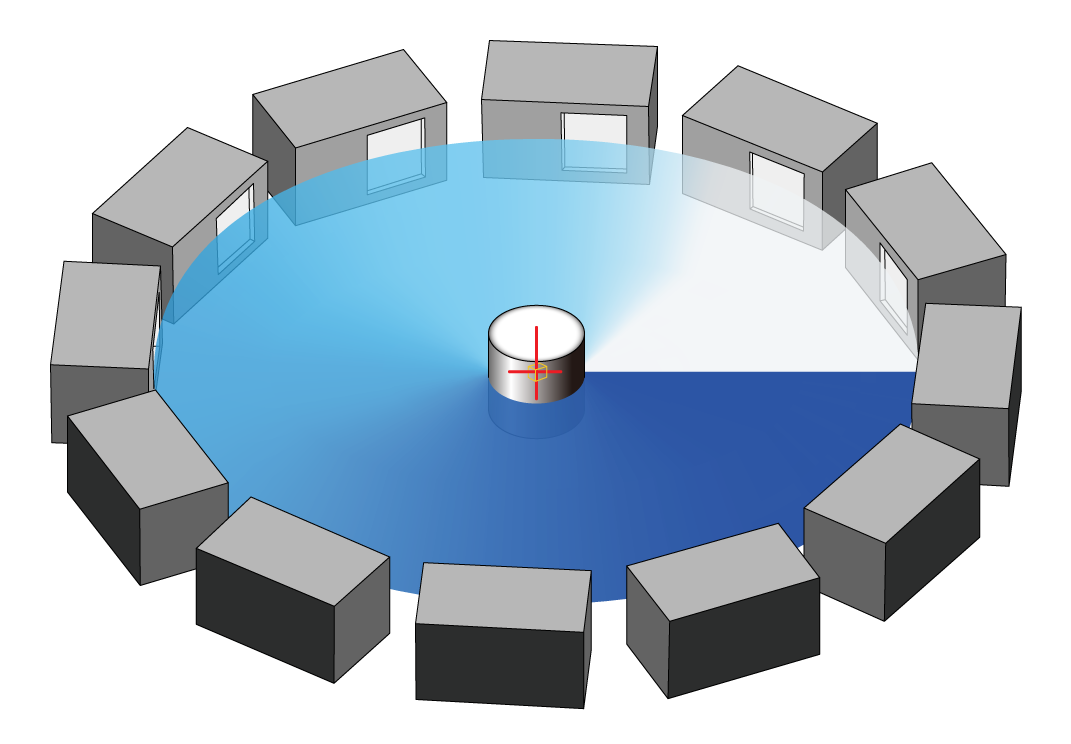
Evaluation system of LiDAR using multiple LHB
This availability helps to analyze LiDAR’s spatial distribution.
Case1 Example of using analysis with multiple LHBs
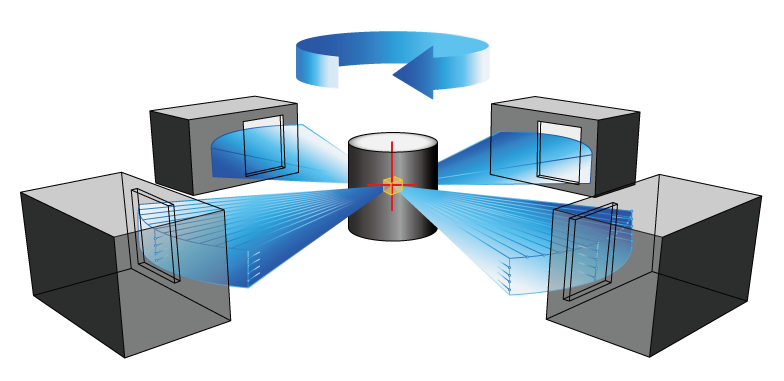
Placed at 90 degrees each in the circumferential direction
Case2 Example of using analysis with multiple LHBs
Placed 4 for each quarter of the circumferential direction.
Case3 Example of using analysis with multiple LHBs
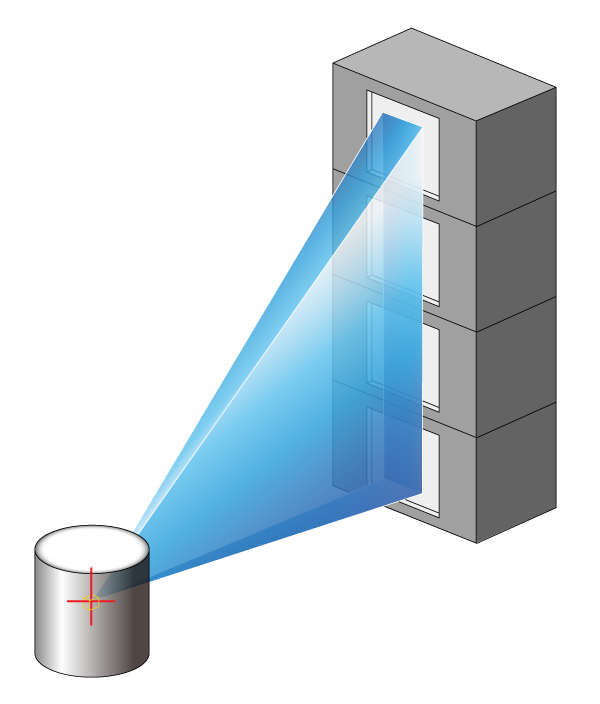
Stacked 4 vertically.
Case4 Example of using analysis with multiple LHBs
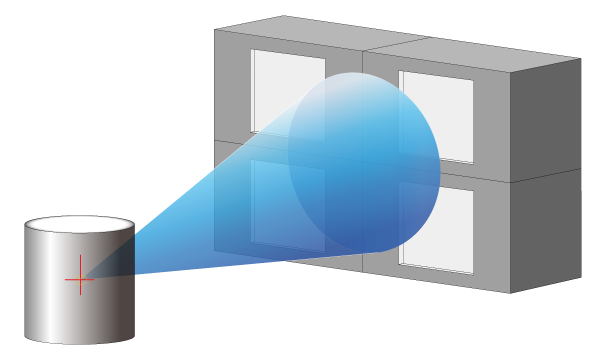
Arranged in the matrix state
Seminar movie
Webinar video of our participation in “Measurement Solution Web Seminar 2020 – For Measurement of Film, Coating and Light Source” hosted by Cybernet Systems, Inc. (Above site is only in Japanese.)
Introduction of the large aperture beam profiler (LaseView-LHB) for evaluation of laser scanners, LiDAR


Sales results of LaseView
- Jet Propulsion Laboratory, NASA
- Continuum Inc.
- LG Electronics
- Wontech
- Avision(Suzhou)CO.,LTD. Mechanical Engineering.Sect.2
- Helmholtz-Zentrum Dresden-Rossendorf (HZDR, Germany)
- Institute of Physics AS CR, v.v.i. (Czech Republic)
- University of Southampton (United Kingdom)
- Hong Kong Precision Industry Co.
- Osaka University
- Kyushu University
- Kyoto University
- Kyoto Institute of Technology
- Shinshu University
- Nagoya University
- University of Electro-Communications
- The University of Tokyo
- Tokyo Institute of Technology
- Sophia University
- The Graduate University for the Creation of New Photonics Industries
- Hiroshima University
- University of Fukui
- Yamagata University
- University of the Ryukyus
- Utsunomiya University
- Institute of Physical and Chemical Research
- National Institute of Laser Technology
- National Institute of Advanced Industrial Science and Technology (AIST)
- Japan Atomic Energy Agency
- National Institute of Information and Communications Technology
- Japan Aerospace Exploration Agency
- Quantum Science and Technology Research Organization
- National Astronomical Observatory of Japan (NAOJ)
- Japan Coast Guard Headquarters
- Information equipment and industrial optical system development manufacturers
- Optical product research and development manufacturer
- Other domestic and foreign private companies
Reviews
- The camera is inexpensive, so don’t worry about breaking it.
- Camera can be used as disposable.
- Easy to prepare.
- The software is intuitive and easy to use.
- Inexpensive.
- M2 beam quality measurement is included as a standard feature, which is very nice.
- The evaluation results showed that the software works as expected, so we have just ordered the software. (used the evaluation version before purchasing)
Distributors
We have distribution channels of “Beam profiler LaseView series” as below.
Dylan Hong
CTL GLOBAL
327, 5, Beobwon-ro 4-gil, Songpa-gu, Seoul, Korea
Tel : +82 070 7779-4500
Fax : +82 42 367 4300
yshong@ctloptics.com
www.youtube.com/channel/UCsovG44FeikIp-zYfLZP3uw
ctl.imweb.me
Bernd Dietz
Geschäftsführer / Managing Director
nortus Optronic GmbH
In den Niederwiesen 4a
D-76744 Wörth am Rhein
Tel : +49-7271-12990-0
Fax : +49-7271-12990-19
info@nortus-optronic.com
www.nortus-optronic.de
If you want to be a distributor, please contact us.
info@symphotony.com