About Camera
About LHB
About Software
All Q&A
Q2: Which camera should I use?
It depends on the wavelength, whether the light is collimated or focused, whether it is CW or pulse, and if it is pulse, the pulse width. If you have any questions about which camera to use, please see the Beam profiler Camera Series.
Q3: Is it necessary to attenuate the laser?
The following is a guideline for the intensity and energy of the laser incident on the camera.
Intensity 1-10 uW/cm2 or less
Pulse energy 10 nJ or less
Lasers of higher intensity and energy require attenuation using an ND filter or the like.
For example, the CA50-NCG sensor saturates at an intensity of about 1 uW/cm2.
For a Class 2 (1mW) laser with a beam diameter of 2mm, the light intensity is estimated to be about 30mW/cm2, requiring attenuation of 4 to 5 orders of magnitude with an ND filter.
Our ND filter set includes several filters. Multiple filters can be used in combination.
Note that for 100 mW or more, attenuation must also be combined with a beam splitter because ND filters cause thermal lensing effects.
If you are looking for a beam profiler that enables measurement simply by inputting a laser beam without using attenuation optics, please use our beam profiler for large apertures and high power (LaseView-LHB).
Q5: Is a CMOS camera inferior to a CCD camera?
Compared to CCD sensors, CMOS sensors have
・Higher fixed pattern noise.
・Sensitivity uniformity and Linearity are inferior.
However, the latest CMOS sensors have solved these problems and can provide characteristics comparable to CCD sensors.
On the other hand, CMOS sensors are superior to CCD sensors in the following areas
・High readout speed (frame rate)
・Low power consumption
・Smaller substrate area
・Low cost.
Please contact us if you have any questions about CMOS cameras or CCD cameras.
Q6: Is there a difference between color and monochrome?
In general, it is not recommended to use a color camera for quantitative beam measurements. The disadvantages of using a color sensor are as follows:
1. low sensitivity, which can be as low as 1/100 or less, especially in the infrared range, due to the built-in IR cut filter
2. lower measurement accuracy when the beam diameter is small, due to the reduced amount of information.
3. LaseView creates a monochrome image from the average of the three RGB color signals, and displays and analyzes that image, resulting in a narrow dynamic range.
4. signal saturation may be difficult to identify and linearity may be significantly reduced.
Q12: Is it possible to use all the pixels of the camera?
It depends on the specifications of the camera. The software can support any resolution.
Q20: Is it possible to use it for fluorescence observation?
Yes, it can be used for fluorescence observation of fluorescent materials. However, if the fluorescence of the material is extremely weak, the sensitivity of the camera may be insufficient and measurement may not be possible.
Q21: Is the gamma value corrected?
Some cameras have an adjustable gamma value, but basically the default gamma value is 1.0, which ensures linearity.
In our recommended cameras, the stored electrons of the CCD are amplified by a linear amplifier, so good linearity can be obtained without gamma correction.
If you need more precise linearity correction, please contact us.
Q22: What is the accuracy of beam diameter measurements? What is the guaranteed accuracy of the beam size range?
LaseView can perform beam size analysis based on Gaussian fitting. The typical standard error of Gaussian fitting is less than 1% when the measurement is performed under proper conditions with low noise. However, the error can vary greatly depending on the measurement conditions (noise level, beam diameter, and beam shape). For a Gaussian profile, high accuracy can be obtained if the full width at half maximum of the beam is approximately 30 times larger than the pixel size of the sensor and less than a quarter of the photosensitive area of the sensor.
Q23: Regarding the LaseView LHB, what are the disadvantages of increasing the measurement area?
The optical resolution becomes worse in proportion to the photosensitive area size, as shown below.
Photocathode width Approximate optical resolution
10 to 20 mm Approx. 25 μm
20 to 40 mm Approx. 50 μm
40 to 80 mm Approx. 100 μm (standard)
80 mm or more Approx. 200 μm
Q24: Tell how to use D4σ.
The threshold value varies from 0 to 100%, where 0% indicates the background and 100% indicates the top of the beam. Normally, there is no problem with the threshold off.
Q25: The D4σ beam diameter is different from the apparent beam diameter.
The beam diameter is defined as four times the D4σ standard deviation, so a beam with a large base component will have a larger diameter than it appears.
Q26: Is baseline subtraction (background subtraction) necessary for D4σ measurement?
Normally, there is no need to use the background subtraction function for D4σ measurement. The software automatically calculates and subtracts the background level when calculating D4σ.
The background subtraction function is effective for improving accuracy when the CCD camera is not exposed to any light and the background level is not flat. When the background subtraction is turned on and the “Set” button is clicked with no light entering the CCD camera, the image at that time is stored internally as the background level, and the background subtraction process is performed from the next image.
If there is a lot of noise, you can get better results by enabling “Averaging” when you click “Set”.
Q27: Does D4σ mean that the diameter is the ±2σ part centered on the center of gravity?
The standard deviation σ in the horizontal and vertical directions is calculated with the center as the mean value, and 4σ is used as the beam diameter.
Q28: When measuring with D4σ, the range automatically changes depending on the beam size. What kind of calculation is used to change the range?
Based on the beam diameter, the integration range is automatically set. Specifically, it calculates the center and standard deviation σ of pixels with a luminance of 50% or more of the peak luminance, and multiplies σ by an appropriate coefficient to set the width. When “Specify range” is turned on, the integration range can be set manually.
If the integration range is too small, the beam diameter will be evaluated as small, and if it is too large, the error due to background will be large. Also, images with low signal-to-noise ratio will have low accuracy.
The advantage of D4σ is that the beam width can be defined for beams of any intensity distribution. However, the disadvantage of D4σ is that the measurement error increases depending on the measurement conditions because of the integral calculation.
Q38: Tell about the linearity of the measured light intensity.
It depends on the performance and specifications of the camera used, but recent camera products do not seem to cause any major problems when the gamma value is set to 1 (or when it can be set).
The camera (LaseView-CA50-NCG) has been confirmed to provide a linear response, but the linearity value cannot be guaranteed. Note that the linearity may vary depending on the camera settings (gain and exposure time).
Q43: The minimum output power of the laser is 30W, and even if I change the exposure or gain, the sensor is instantly saturated. Also, the light spreads out horizontally and the intensity distribution cannot be measured. Is it difficult to measure this kind of laser light with the standard specification of LHB-100?
If the image is saturated even when the gain and exposure time are minimized, the only option is to reduce the light intensity. The light intensity can be reduced by a factor of 10 to 100 by introducing the reflected light from the wedge plate or transmitted light from the HR mirror into the LHB. When purchasing, it is possible to reduce the sensitivity by incorporating a higher density ND filter. Also, the symptom of horizontal lines appearing is a phenomenon called smear, which occurs when strong light enters the camera.
Q44: The new OAS-CA50-100 combines two beam splitters to increase attenuation, but is it possible to remove one beam splitter and use it like the OAS-CA50?
One beam splitter can be removed. In the case of the OAS-CA50-100, two beamsplitters can cancel out polarization dependence, making it polarization independent.
Q45: Is it correct to place an ND filter between the light source (laser beam) and the camera as a way of attenuating the CA50-NCG by myself?The power is 100W
Since ND filters cannot withstand high output light, a high output-compatible attenuator is required before the ND filter. It is common to use transmitted light from a high-reflection mirror or reflected light from a low-reflection beamsplitter for measurement.
Q50: Regarding LaseView-CA50-NCG, please let us know: ・Frame rate ・Detection limit intensity (saturation intensity (W/cm2) ・Minimum detectable intensity (W/cm2)
The following is a description of LaseView-CA50-NCG.
・Frame rate: up to 12 fps
・Saturation intensity (W/cm2): 1 to 10 μW/cm2 (approximate at 1 ms exposure time)
・Minimum detectable intensity (W/cm2): 0.01 to 0.1 μW/cm2 (as a guide when exposure time is 80 ms)
*Saturation intensity and detection sensitivity depend on wavelength.
・Exposure time setting range: 17 μs to 80 ms
Q57: About beam splitters, is it possible to disclose the structure inside? Is there a structure that can contain a bandpass?Can the amount of light attenuation be quantified?
An uncoated wedge plate (beamsplitter) is used to reflect light at an angle of incidence of 45 degrees.
After reflection, the light is attenuated by an ND filter.
If the direction of polarization and wavelength are known, the reflectance of the beamsplitter can be calculated.
Since there are individual differences in the transmittance of ND filters, measurement is required for accurate quantification.
Q81: I have a question about the MIR series of LaseView camera sets. What is the detection method of the sensor, the time constant and the upper limit of the incident light level?
Details cannot be disclosed, but the sensor is a microbolometer. The IntegrationTime of this detector is fixed and is 50 µsec. The thermal time constant is 10-30 ms. It is equivalent for all models. The upper limit of the incident light intensity cannot be determined as no destructive testing has been carried out, but in past experience, the element has been damaged in approximately several msec to 10 msec. Basically, detection is sufficient in the order of µsec.
Q85:The CA50-NCG-BE is used to measure beam diameters of around 5 µm. When the beam profiler is moved back and forth from the spot position to measure the beam shape, the beam shape is not targeted and appears slightly distorted. Please explain why the shape is different when moving away from the spot position.
The beam pattern before and after focus can vary significantly, affected by slight wavefront distortions of the light source. In addition, the pre- and post-focus beam patterns are generally different. There are only a few exceptions: as an example, in an ideal Gaussian beam, the beam pattern does not change at and around the focal point and is always a Gaussian function. Conversely, if there is even a small amount of wavefront distortion or if the intensity distribution is not Gaussian, the beam pattern before and after the focus will not be identical. This is because the beam pattern changes according to the Fresnel diffraction equation.
https://ja.wikipedia.org/wiki/%E3%83%95%E3%83%AC%E3%83%8D%E3%83%AB%E5%9B%9E%E6%8A%98
Q8: Is it possible to add functions?
Customization is available upon request. Please contact us for details and costs.
Q20: Is it possible to use it for fluorescence observation?
Yes, it can be used for fluorescence observation of fluorescent materials. However, if the fluorescence of the material is extremely weak, the sensitivity of the camera may be insufficient and measurement may not be possible.
Q21: Is the gamma value corrected?
Some cameras have an adjustable gamma value, but basically the default gamma value is 1.0, which ensures linearity.
In our recommended cameras, the stored electrons of the CCD are amplified by a linear amplifier, so good linearity can be obtained without gamma correction.
If you need more precise linearity correction, please contact us.
Q22: What is the accuracy of beam diameter measurements? What is the guaranteed accuracy of the beam size range?
LaseView can perform beam size analysis based on Gaussian fitting. The typical standard error of Gaussian fitting is less than 1% when the measurement is performed under proper conditions with low noise. However, the error can vary greatly depending on the measurement conditions (noise level, beam diameter, and beam shape). For a Gaussian profile, high accuracy can be obtained if the full width at half maximum of the beam is approximately 30 times larger than the pixel size of the sensor and less than a quarter of the photosensitive area of the sensor.
Q23: Regarding the LaseView LHB, what are the disadvantages of increasing the measurement area?
The optical resolution becomes worse in proportion to the photosensitive area size, as shown below.
Photocathode width Approximate optical resolution
10 to 20 mm Approx. 25 μm
20 to 40 mm Approx. 50 μm
40 to 80 mm Approx. 100 μm (standard)
80 mm or more Approx. 200 μm
Q24: Tell how to use D4σ.
The threshold value varies from 0 to 100%, where 0% indicates the background and 100% indicates the top of the beam. Normally, there is no problem with the threshold off.
Q25: The D4σ beam diameter is different from the apparent beam diameter.
The beam diameter is defined as four times the D4σ standard deviation, so a beam with a large base component will have a larger diameter than it appears.
Q26: Is baseline subtraction (background subtraction) necessary for D4σ measurement?
Normally, there is no need to use the background subtraction function for D4σ measurement. The software automatically calculates and subtracts the background level when calculating D4σ.
The background subtraction function is effective for improving accuracy when the CCD camera is not exposed to any light and the background level is not flat. When the background subtraction is turned on and the “Set” button is clicked with no light entering the CCD camera, the image at that time is stored internally as the background level, and the background subtraction process is performed from the next image.
If there is a lot of noise, you can get better results by enabling “Averaging” when you click “Set”.
Q27: Does D4σ mean that the diameter is the ±2σ part centered on the center of gravity?
The standard deviation σ in the horizontal and vertical directions is calculated with the center as the mean value, and 4σ is used as the beam diameter.
Q28: When measuring with D4σ, the range automatically changes depending on the beam size. What kind of calculation is used to change the range?
Based on the beam diameter, the integration range is automatically set. Specifically, it calculates the center and standard deviation σ of pixels with a luminance of 50% or more of the peak luminance, and multiplies σ by an appropriate coefficient to set the width. When “Specify range” is turned on, the integration range can be set manually.
If the integration range is too small, the beam diameter will be evaluated as small, and if it is too large, the error due to background will be large. Also, images with low signal-to-noise ratio will have low accuracy.
The advantage of D4σ is that the beam width can be defined for beams of any intensity distribution. However, the disadvantage of D4σ is that the measurement error increases depending on the measurement conditions because of the integral calculation.
Q29: What is the role of the switch on the side of the profiler?
ON/OFF switch for the screen oscillation motor for speckle reduction. Turning the motor ON and the software "averaging" ON will reduce speckle noise. Note that if the motor is not used, there is no need to connect the AC adapter.
When measuring a laser beam with a narrow line width, speckle noise may occur in the beam profile. When measuring narrow linewidth laser beams, speckle noise may occur in the beam profile. Speckle noise can be reduced by oscillating the screen and performing averaging processing using software. speckle noise can be reduced by oscillating the screen and performing averaging by software. (For low interference light sources such as LEDs, speckle noise does not occur. (For low-interference light sources such as LEDs, speckle noise is not generated, so there is no need to use this function.)
Q30: When the switch on the side wall of the profiler is turned upward, there is a shuffling sound, is this normal?
The sound is normal. It is the gear noise of the internal motor.
Q31: In the toolbar of the software, there are buttons for “Stop” and “Disconnect”, etc. What is the procedure for shutting down the software?
There is no specific procedure. No matter what you do, the program will automatically take the appropriate action.
For example, there is no problem if you close the application or disconnect the USB while it is being displayed.
Q38: Tell about the linearity of the measured light intensity.
It depends on the performance and specifications of the camera used, but recent camera products do not seem to cause any major problems when the gamma value is set to 1 (or when it can be set).
The camera (LaseView-CA50-NCG) has been confirmed to provide a linear response, but the linearity value cannot be guaranteed. Note that the linearity may vary depending on the camera settings (gain and exposure time).
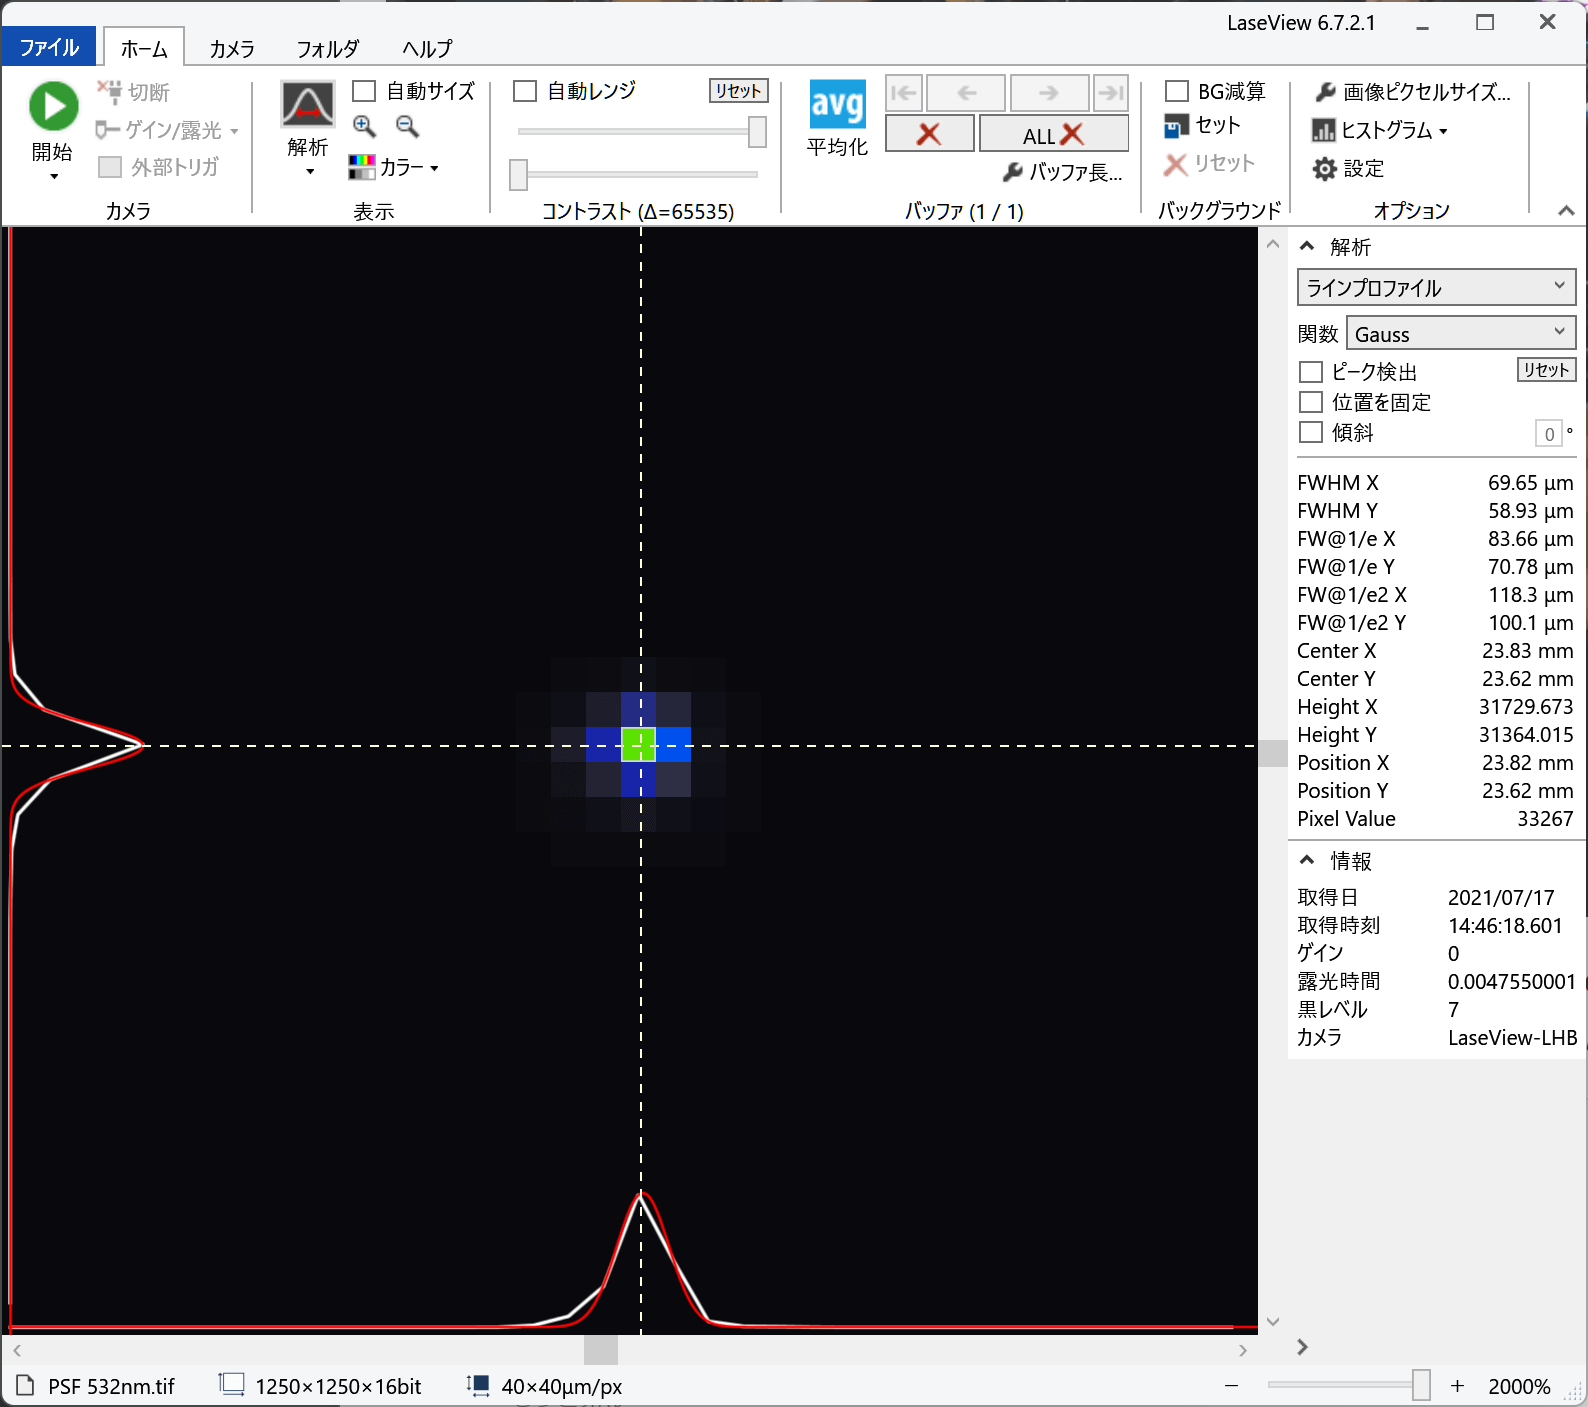
Q41: Tell about the resolution of the LHB series. In the catalog, the resolution is 100um, so I assumed that one pixel output in csv is 100um. Is this a correct understanding?
The optical resolution of 100um in the catalog value refers to the resolution of the internal optical system, which is larger than the size of a single pixel. The size of a pixel is the width of the light receiving surface divided by the number of pixels in the acquired image: 50 mm / 1250 = 40 µm.
The size of a pixel is displayed in the status bar of the screen as pixel size.
Q43: The minimum output power of the laser is 30W, and even if I change the exposure or gain, the sensor is instantly saturated. Also, the light spreads out horizontally and the intensity distribution cannot be measured. Is it difficult to measure this kind of laser light with the standard specification of LHB-100?
If the image is saturated even when the gain and exposure time are minimized, the only option is to reduce the light intensity. The light intensity can be reduced by a factor of 10 to 100 by introducing the reflected light from the wedge plate or transmitted light from the HR mirror into the LHB. When purchasing, it is possible to reduce the sensitivity by incorporating a higher density ND filter. Also, the symptom of horizontal lines appearing is a phenomenon called smear, which occurs when strong light enters the camera.
Q47: Regarding LHB, I understand that the data output in CSV data is 1440 x 1080, which is the number of effective pixels of the sensor.
The number of pixels acquired is 1600 x 1600 pixels, corresponding to a screen center of 50mm x 50mm. Therefore, the pixel pitch is 31.25μm.
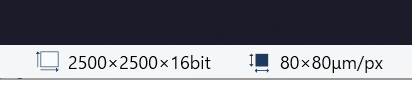
Q51: Regarding LHB-200, I would like to know the size in real space per cell. 200mm/2500 cells = 80μm, is that correct? I am concerned because the above value is smaller than the resolution in the catalog specs. Also, is it possible to check the pixel size on LaseView?
That is correct. The resolution in the catalog specifications refers to the optical resolution, which indicates the degree of blur when observing a tiny spot. Therefore, the resolution is a large value compared to the pixel size. Pixel size is displayed at the bottom of the screen (see the figure below).
Q52: With respect to the LHB series, do you know the fill factor of this sensor? We are considering to estimate the peak power density by analyzing the power measured separately and the counts of the profile acquired by this sensor. After converting the counts to power, we believe that a fill factor is needed to convert the counts to density by dividing by pixel size.
The fill factor of the sensor is unknown as it has not been published by the manufacturer. Since the fill factor per pixel is a constant value, the power density can be estimated even if the fill factor is unknown. Using “peak-integral” analysis, the power density can be easily estimated. Multiply this value by the incident laser power to obtain the power density in W/cm2. This value is only an estimate. Please note that the accuracy may decrease depending on the situation.

Q65: Multiple beams with intensity differences of about several uW~ several mW are simultaneously injected into the LHB without ND filter. If I set the exposure time so that the maximum intensity beam is not saturated, I cannot acquire a weak intensity beam, and if I adjust the exposure time so that the weak beam is acquired, the maximum intensity beam is saturated. I would like to know if there is a way to measure this successfully.
It is not possible to measure spots of widely differing intensity simultaneously. This is because the dynamic range of the camera is only about 2.5 digits (about 300:1).
There are two ways to measure the intensity of a spot.
1. Separate measurement of strong and weak spots at two separate times.
In this case, the exposure time, etc., is fixed and measurement is performed with and without an ND filter of known transmittance, and the intensity can be converted after measurement to compare the intensity of the strong and weak spots.
2. Insert an ND filter of known transmittance only in the strong beam area. In this case, only one measurement is needed. A small size ND filter is required.
Q67:What are the quality check criteria and check methods for trapezoidal correction of LHB? Regarding trapezoidal correction, up to how many pixels difference is the specification when looking at the corners?
The LHB is moved vertically and horizontally on a calibrated precision motorized stage, and the spatial distortion of the entire photosensitive area is measured by calculating the difference between the center of gravity of the laser beam measured by the LHB and the actual position at 10 x 10 points (100 points) on a grid. Calibration data is created based on these measured values, and the distortion is corrected by software. This distortion correction is enabled by installing the LHB Driver with the same serial number.
For example, in the case of LHB-100, 1 pixel is 62.5um, so the linearity error is within 300um/62.5um = 4.8 pixels.
Q68:What is the "position linearity error" in the LHB test report?
The "position linearity error" in the test report is a value representing the amount of spatial distortion of the instrument. The position linearity error is measured by moving the main unit of the LHB on a calibrated motorized stage and calculating the difference between the center of gravity of the laser beam measured by the LHB at each position and the actual position.
The definition of position linearity error is the same as that of linearity in the following site.
https://www3.panasonic.biz/ac/e/service/tech_support/fasys/glossary/measurement/002/index.jsp
Q69:We are considering LHB. Is it safe to measure by sticking the luminous surface of the product to the screen to reduce the spread of light?
If the screen is not burnt by light exposure, sticking is not a problem.
Q75: I am considering LHB-200 and LHB-100 to check the profile of a laser for a processing application. The wavelength is 940-1064nm, so I think it is OK, but the incident power is 500W to 1kW continuous light.
Standard products can be used by either of the following methods.
(1) Attenuate the incident light to an average of 10W or less.
(2) Shorten the time of laser incidence.
With the standard specifications, the maximum incident light intensity is 10W at continuous incidence. Due to the heat resistance limitation of the screen, the light intensity of the incident light should also not exceed 100 W/cm2. It is possible to input more than 1 kW for a short time as long as the temperature of the main unit of the measuring instrument does not exceed 40°C. As a rough guide, 1 kW can be input for a maximum of 10 seconds when the room temperature is 25°C with LHB-100. 500 W can be input for a maximum of 20 seconds. However, the temperature of the enclosure will rise due to the injection, and you will need to wait until the temperature of the unit cools down before taking the next measurement.
Q79: I am using LHB-100. Stray light is very strong and affects the acquisition of profiles in the XY direction. I understand that stray light occurs at an incident angle of ±15deg or more. Also, how is the angular resolution calculated by setting the distance between the screen and the light source? Is it correct to assume that the angular resolution increases as the distance increases? For example, when we calculated the angular resolution at a distance of 20mm, we got a value of 0.18deg per pixel near the center.
Reducing stray light deteriorates resolution. We are considering developing a product that reduces stray light. The specification is that the angular resolution is 3.3 deg for a full angle of 160 deg.
The distance between the screen and the light source is 8.8mm. The angular resolution increases as the distance is increased.
In the case of LHB-100, the spatial size of one pixel is 50μm, but the resolution of the optical system is about 200μm, meaning that the image will be blurred by this degree. At a distance of 20mm, the optical resolution would be 0.57deg.
Q1: What cameras are supported ?
What cameras are supported?
Monochrome cameras from The Imaging Source, iDS, Basler, and Artray’s 424KY, 445KY, and 150P5 series are supported. Other cameras may also be compatible, so please contact us for details. Some Thorlabs cameras are OEM of iDS cameras, so you may be able to use them by removing Thorlabs drivers and installing iDS drivers.
Q4: Is it possible to use it as a power meter?
The CCD has a function to display the relative total power integrated over the entire beam, but it is not calibrated in absolute terms and cannot measure the absolute power because the sensitivity of the CCD and the amount of dark current depend on temperature.
It is possible to remove the temperature dependency by using a cooled CCD (with temperature control). However, the dynamic range of CCDs is about three digits, so the upper limit of the dynamic range for power measurement is about 1000 counts.
Q7: Is it possible to update LaseView after purchase?
Updates are available free of charge for one year after purchase.
Q8: Is it possible to add functions?
Customization is available upon request. Please contact us for details and costs.
Q9: Are there any differences from LaseView 3 (previous versions)?
The following features have been added.
(1) M2 Analysis function
(2) Automatic peak following function based on center calculation
(3) Improved usability
(4) More cameras supported (Imaging Source, iDS, Basler, Artray)
(5) Improved stability
(6) Improved processing speed by parallel computing
(7) Japanese language support
Q10: Is it possible to run two screens at the same time?
LaseView does not have any limitations. However, due to hardware limitations, two cameras may conflict with each other and fail to work. So PC with multiple USB controllers is less likely to have conflict issues.
Q11: Is it possible to subtract the background
The background can be subtracted by using the dark correction function.
Q13: Is it possible to record the edges of past beams to see the beam misalignment?
If the ” Fix Position” option is turned on in the line profile analysis or peak integration analysis, the position of the crosshairs will be retained even after the software is closed.
Q14: Is it possible to measure the center ?
Yes, we can.
Q15: Is it possible to measure the integral value of power?
It is possible to measure the integral value with the peak integration function.
Q16: Is it possible to move the plot position by one pixel at a time?
It is possible by using the mouse.
Q17: Is it possible to specify the coordinates?
The coordinates of the specified position will be displayed by mouse operation, so it’ s possible to adjust to the desired coordinates while viewing the coordinates.
Q18: Is it possible to export the analysis results?
Yes, it is possible to export the results from the menu
File -> Options -> Save Graph Data.
Q19: Is it possible to export images?
In addition to saving screenshots, it is possible to export images including analysis results.
Q20: Is it possible to use it for fluorescence observation?
Yes, it can be used for fluorescence observation of fluorescent materials. However, if the fluorescence of the material is extremely weak, the sensitivity of the camera may be insufficient and measurement may not be possible.
Q21: Is the gamma value corrected?
Some cameras have an adjustable gamma value, but basically the default gamma value is 1.0, which ensures linearity.
In our recommended cameras, the stored electrons of the CCD are amplified by a linear amplifier, so good linearity can be obtained without gamma correction.
If you need more precise linearity correction, please contact us.
Q22: What is the accuracy of beam diameter measurements? What is the guaranteed accuracy of the beam size range?
LaseView can perform beam size analysis based on Gaussian fitting. The typical standard error of Gaussian fitting is less than 1% when the measurement is performed under proper conditions with low noise. However, the error can vary greatly depending on the measurement conditions (noise level, beam diameter, and beam shape). For a Gaussian profile, high accuracy can be obtained if the full width at half maximum of the beam is approximately 30 times larger than the pixel size of the sensor and less than a quarter of the photosensitive area of the sensor.
Q24: Tell how to use D4σ.
The threshold value varies from 0 to 100%, where 0% indicates the background and 100% indicates the top of the beam. Normally, there is no problem with the threshold off.
Q25The D4σ beam diameter is different from the apparent beam diameter.
The beam diameter is defined as four times the D4σ standard deviation, so a beam with a large base component will have a larger diameter than it appears.
Q26: Is baseline subtraction (background subtraction) necessary for D4σ measurement?
Normally, there is no need to use the background subtraction function for D4σ measurement. The software automatically calculates and subtracts the background level when calculating D4σ.
The background subtraction function is effective for improving accuracy when the CCD camera is not exposed to any light and the background level is not flat. When the background subtraction is turned on and the “Set” button is clicked with no light entering the CCD camera, the image at that time is stored internally as the background level, and the background subtraction process is performed from the next image.
If there is a lot of noise, you can get better results by enabling “Averaging” when you click “Set”.
Q27: Does D4σ mean that the diameter is the ±2σ part centered on the center of gravity?
The standard deviation σ in the horizontal and vertical directions is calculated with the center as the mean value, and 4σ is used as the beam diameter.
Q28: When measuring with D4σ, the range automatically changes depending on the beam size. What kind of calculation is used to change the range?
Based on the beam diameter, the integration range is automatically set. Specifically, it calculates the center and standard deviation σ of pixels with a luminance of 50% or more of the peak luminance, and multiplies σ by an appropriate coefficient to set the width. When “Specify range” is turned on, the integration range can be set manually.
If the integration range is too small, the beam diameter will be evaluated as small, and if it is too large, the error due to background will be large. Also, images with low signal-to-noise ratio will have low accuracy.
The advantage of D4σ is that the beam width can be defined for beams of any intensity distribution. However, the disadvantage of D4σ is that the measurement error increases depending on the measurement conditions because of the integral calculation.
Q31: In the toolbar of the software, there are buttons for “Stop” and “Disconnect”, etc. What is the procedure for shutting down the software?
There is no specific procedure. No matter what you do, the program will automatically take the appropriate action.
For example, there is no problem if you close the application or disconnect the USB while it is being displayed.
Q32: I would like to measure the beam profile and divergence angle. Is “Line Profile” the best analysis mode for this, or “Integral Profile” if the profile is violent?
If the profile is violent, the “Averaging” function is suitable.
You can also analyze the beam divergence angle of the saved images by clicking [Folder] -> [Batch Analysis].
Q33: In LasaView, if I basically save the image as “Save Image” – “*.tif”, I can later open the image and analyze it for FWHM, etc., and also export it to csv?
Exactly.
Q34: About “Save the numerical data of the graph”, when saving the csv “Hori.i:Y” is the profile of the horizontal direction of the crosshairs, right? “Ver.Y” is the vertical profile of the crosshairs, right?
Exactly.
Q35: About “Save the numerical data of the graph” Is there a way to save a profile of any cross section? Is there any way to save a 3D (full) profile?
To save the profile of an arbitrary cross section, select “Line Profile” in Analysis and move the crosshairs to the desired position with the mouse.
The numerical data of all pixels can be saved from [File]->[Export Image]->[CSV Text].
Q36: Is the pixel size still the “default” setting?
In LaseView-LHB, the “default” pixel size is set to 40 x 40µm (62.5 x 62.5µm in LHB-100).
The pixel size has been calibrated and should normally be left unchanged.
If the pixel size display at the bottom of the window shows (not set), the LHB driver may not have been installed properly.
Q37: In the csv that I saved by selecting “Line Profile” and then “Save Graph Data”, there are columns named “Fit Hori. X/Y” and “Fit Vert.X/Y” What does this mean? Also, in other modes, are there other columns added?
When you select a Gauss fit in the analysis, a graph in red will appear on the screen, and Fit Hori. X/Y are the numerical data of the red line.
Q38: Tell about the linearity of the measured light intensity.
It depends on the performance and specifications of the camera used, but recent camera products do not seem to cause any major problems when the gamma value is set to 1 (or when it can be set).
The camera (LaseView-CA50-NCG) has been confirmed to provide a linear response, but the linearity value cannot be guaranteed. Note that the linearity may vary depending on the camera settings (gain and exposure time).
Q39: Is there any information on spectral response (300 nm and below)?
There is no data on spectral response below 300 nm. It has been confirmed that the excimer laser has sensitivity up to 193 nm, but the sensitivity below 300 nm is one to three orders of magnitude lower than the visible range.
Q40: Is Internet connection required for LaseView license activation?
Internet connection is required only for activation during installation.
Q42: In the device selection, there are two options, DirectShow and ImagingSource, do they have different functions and performance?
Normally, please use ImagingSource.
DirectShow can only acquire 8-bit images by default.
ImagingSource can acquire 12-bit images.
There are also some differences, such as the exposure time being displayed in real time.
Q43: The minimum output power of the laser is 30W, and even if I change the exposure or gain, the sensor is instantly saturated. Also, the light spreads out horizontally and the intensity distribution cannot be measured. Is it difficult to measure this kind of laser light with the standard specification of LHB-100?
If the image is saturated even when the gain and exposure time are minimized, the only option is to reduce the light intensity. The light intensity can be reduced by a factor of 10 to 100 by introducing the reflected light from the wedge plate or transmitted light from the HR mirror into the LHB. When purchasing, it is possible to reduce the sensitivity by incorporating a higher density ND filter. Also, the symptom of horizontal lines appearing is a phenomenon called smear, which occurs when strong light enters the camera.
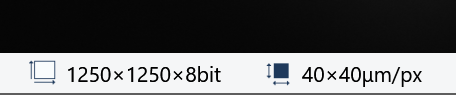
Q46: What happens when a beam smaller than the optical resolution is injected?
When the optical resolution is 100 μm, an incident beam smaller than this produces a point spread function equivalent to 2 to 3 pixels as shown in the attached figure, and this width is used as the optical resolution. The optical resolution is determined by the performance of the lens optics between the sensor and the light-receiving part.
Q48: Is the bit depth of the power density 16 bits?
You can switch between 8-bit and 16-bit on the software. [The switch can be made in the CAMERA tab, under CAMERA SETTINGS, and then under Pixel Format.
Q49: How will the measurement range be set and determined?
Light intensity and image luminance signal are proportional, but the physical quantity of light intensity and the signal quantity are not calibrated. Sensitivity varies depending on the camera gain and exposure time settings.
Q53: When the laser beam spot is elliptical, is it possible to automatically select and measure the length of the major and minor axes?
It is possible to measure the width of the major and minor axes of an ellipse, but the tilt of the axes must be set manually (mouse operation).
Q54: When a laser spot has a distorted shape, is it possible to obtain cross-sectional information at a specified position?
When the intensity distribution is distorted, it is possible to evaluate the beam diameter using analysis methods such as D4σ.
Q55: About the light intensity distribution of spot light, is it possible to change the cross-sectional position of light intensity distribution to a different position later?
A Two-dimensional intensity distribution can be acquired and saved as an image. One-dimensional intensity distribution on any line on the two-dimensional image can be displayed. The position of the line can be changed by mouse operation.
Q56: When the light intensity of a light source is unstable, Is it possible to average the light by integration, etc.? Is it possible to adjust the amount of averaging?
The latest multiple images are always buffered.
There is a mode that displays an averaged image of the images in the buffer in real time.
The buffer length (number of images to be averaged) can be changed to any number.
Q58: Regarding the output format of light source information, is it possible to save it in a format that can be imported into ZEMAX, LT, etc.?
The acquired images are saved in TIFF or CSV format. ZEMAX and other formats are not supported.
Q59: Which values of the multiple image files are specifically read and calculated? Please also tell us the calculation formula for this. Also, what information does the green dotted line indicate when the beam is surrounded by a green dotted line when using the beam diameter and centre of gravity in the analysis?
If 'Second Moment (D4σ)' is selected under 'Method', half (radius) of the D4σ X and D4σ Y values of the 'Beam diameter and centre of gravity' analysis are displayed.
If 'Gaussian Fitting (1/e2)' is selected, half of the FW@1/e2 X and FW@1/e2 Y values of the 'Line profile (Gauss)' analysis are displayed.
The green dotted line also indicates the integration range. By restricting the integration range to an appropriate range, the accuracy of the calculation is prevented from deteriorating.For more information on D4σ and 1/e2 widths, please see the following website.
https://en.symphotony.com/products/laseview/principle/diameter/
Q60: As a general question, does the wavelength of the light source used in the measurement affect the measurement data and calculation results?
Measurement results are not affected by wavelength. However, the beam quality (M2) measurement is wavelength dependent, so please enter the wavelength.
Q61: Is it difficult to measure the divergence angle for a single image (without data in buffer)?
If the position of the beam waist (fiber end) of the light source is known, the divergence angle can be calculated from the beam width of a single image. The formula is as follows:
Beam divergence angle = beam radius / distance from beam waist to sensor
Q62: Also, the data calculated by increasing the number of measurement points is shown as an approximate straight line, but is there any possibility that it is inherently non-linear? Also, when measuring the divergence angle of a fiber, is there any difference between the results at a long distance and at a short distance (e.g., multiple points at a long distance are more accurate)? (e.g., multiple points at a long distance are more accurate).
In general, if the beam divergence angle is large and far from the beam waist, it will asymptotically approach a straight line. To measure near the beam waist, use the beam quality (M2) measurement function. However, this does not apply if the beam shape varies with position (no Gaussian beam). When measuring multiple images, the greater the change in beam diameter, the greater the accuracy. In other words, the larger the distance, the more accurate the measurement. If the beam shape varies with position (no Gaussian beam), the results at far and near distances may differ significantly.
Q63: Is your method of calculating M2 in line with ISO 11146? Please tell us how you calculate M2.
Yes, LaseView performs the analysis in a manner consistent with ISO 11146. It automatically analyzes images at multiple locations near the beam waist and calculates the secondary moment width (D4σ) at each location. The curve of the variation of the secondary moment width is fitted by the least-squares method to calculate M2, beam waist diameter, beam divergence angle, etc. It is not compliant with ISO11146-2, but calculates the secondary moment width of the ISO11146-1 power density distribution. In principle, it would be difficult to measure the Wigner distribution function specified in ISO11146-2 using only a standard beam profiler.
Q64: If you change the gain, etc., I believe the beam diameter will also change. If we change the laser incident power, we would need to adjust the gain, exposure, etc. Is there any way to accurately measure the beam diameter when changing the laser power?
For more accurate measurements, please pay attention to the “black level” setting. The dark purple area on the screen indicates that the signal is below 0. In this case, the background level is clipped at 0, resulting in a smaller beam diameter analysis result than actual. In the “Camera” tab, select “Others” > “Black Level” and increase the value of the black level until the dark purple area disappears. It is inevitable that there will be some errors in the analysis results depending on the gain, exposure time, and light level. To reduce noise, set the gain to the minimum (0). Also, increase the light level or exposure time to increase the signal level to the point where it does not saturate, and perform the measurement with a high signal-to-noise ratio. Averaging multiple images using the “Averaging” function may reduce noise.
Q66: We would like to operate with several GigE cameras, but trigger operation causes the camera to stop working after about 3 cameras. We see on the website that there is an option for USB cameras and we think it works with 4 cameras, etc. Is a USB connected camera better?
When multiple GigE cameras are connected using a hub, bandwidth may be insufficient. You may need to reduce the frame rate to reduce the amount of data, or add multiple Ethernet boards to the PC to secure bandwidth. Enabling jumbo packets may also help. Ideally, there should be one camera per Ethernet controller; there are boards on the market that have independent 4-port controllers on a single board.
Q70: How is the order of the files determined when a folder is imported? Is it necessary to manually sort the output CSV results?
When a folder is opened, the order of files is sorted by modification date.
Usually, the order is the order in which the files were saved.
Q71: The logging interval for image logging, can it be less than 1 second (e.g. 0.1 second)?
This is not possible. If the interval is too short, the file saving process will not be completed in time.
As an alternative, set the "Frame Rate" to 10 (Hz) in the "Camera" tab > "Camera Control" > "Others" and save the images stored in the buffer to save images at intervals of 1 second or less.
Q72: Regarding averaging, when averaging is checked, does it average the intensity of each pixel in the most recently captured image for the number of images set by the buffer length? What is the maximum buffer length that can be set?
That is correct. Changing the buffer length changes the number of images to be averaged. There is no upper limit to the buffer length. The upper limit is determined by the memory capacity of the PC. Please note that very large buffer lengths may cause OS instability.
Q73: Am I correct in thinking that the length of averaging depends on the exposure time set by the camera control? For example, if the exposure time is 1ms and the buffer length is 100, does this mean that the averaging will be for the last 100ms?
The interval at which images are captured from the camera depends on the "Frame Rate" setting. For example, a frame rate of 10 Hz and a buffer length of 100 results in an average of 10 seconds.
Q74: If "Save all images in buffer" is selected for image logging, will 100 images be saved before averaging if the buffer length is 100?
That's right: 100 images are stored in a single file (multipage TIFF).
Q77: My camera does not support DirectShow, is there a way to use it with LaseView?
If we create a custom driver, you can use it with LaseView. We have many experiences.
The following two conditions are required.
1) The camera must be provided to us at least for two weeks.
2) The camera manufacturer must provide an SDK (Software Development Kit).
The delivery period is 2 weeks after receipt of the camera and the cost will be quoted on a case-by-case basis.
Q78: I clicked on the LaseView download link but could not open it with an error.
For evaluation licenses, the link cannot be opened once it expires. Please contact us again.
Q80:When I look at an image in Windows Paint that looked good in LaseView, it is black. When I reopen it in LaseView, it looks clean. It seems to be saving correctly, but is there any way to make it visible in Explorer? Also, the file size was initially about 2.2 MB per file, but now I see it is about 20 MB. Is this possible?
For evaluation licenses, the link cannot be opened once it expires. Please contact us agIf the bit number is set to 8bit in "Camera" -> "Camera Settings" -> "Pixel Format", the image will be saved as an 8bit image and will not be black in Explorer, etc.
If "Save all images in buffer" is checked, multiple images will be saved in one file, resulting in a larger file size. In this case, the file format is called multipage TIFF. Even if "Save all images in buffer" is checked, thumbnails will still be displayed if the image is an 8-bit image.
Q82: When the sensor (CA50-NCG) is not lit, the LaseView screen is When the sensor (CA50-NCG) is not illuminated, the LaseView screen shows a large number of horizontal stripes, which remain in the background even when the light is switched on. Is there any way to improve this?
If the amount of incident light is low with 'Auto Range' ON, the fixed pattern noise of the sensor becomes more noticeable. Also, if the 'Gain' is increased, the noise will increase. Fix the gain at around 400 and adjust the incident light level and exposure time to obtain good S/N.
Due to the characteristics of the camera, setting the gain to a small value for the CA50-NCG will cause the sensor to saturate before the A/D converter saturates. To maximise the dynamic range, we recommend measuring with a gain of around 400.
If 'AutoRange' is on, please switch 'Home' → 'AutoRange' off and press 'Reset' next to it.
After that, please make sure that sufficient light is incident to the sensor to prevent it from being saturated, and perform the measurement.
If the fixed pattern noise of the sensor bothers you, use the background subtraction function.
Turn on [Home] → [BG subtraction] and press [Set] with no light entering the camera.
The image at the time of pressing [Set] is stored and subtracted from subsequent images to flatten the background.
Q83: In some cases the exposure time/gain is displayed as Auto. Why is this? In the case of Auto, there was no change. If it was set to a numerical value, it could be adjusted by moving the slide left or right.
The camera's default value is set to Auto, so it may become Auto the first time it is connected. By moving the slide to the left or right, the value will be set and the camera will not be in Auto the next time. Do not normally use the camera in the Auto state.
Q84: I would like to know about the software LaseView, can I also extract RAW data from the camera with this software? Or can RAW data be extracted without using LaseView?
There is no function to save images in RAW format. However, TIFF format files saved by LaseView contain uncompressed image data equivalent to RAW data. The system also supports saving files in CSV format (text format), which allows the raw data to be displayed in Excel and other applications.
Q1: What cameras are supported ?
What cameras are supported?
Monochrome cameras from The Imaging Source, iDS, Basler, and Artray’s 424KY, 445KY, and 150P5 series are supported. Other cameras may also be compatible, so please contact us for details. Some Thorlabs cameras are OEM of iDS cameras, so you may be able to use them by removing Thorlabs drivers and installing iDS drivers.
Q2: Which camera should I use?
It depends on the wavelength, whether the light is collimated or focused, whether it is CW or pulse, and if it is pulse, the pulse width. If you have any questions about which camera to use, please see the Beam profiler Camera Series.
Q3: Is it necessary to attenuate the laser?
The following is a guideline for the intensity and energy of the laser incident on the camera.
Intensity 1-10 uW/cm2 or less
Pulse energy 10 nJ or less
Lasers of higher intensity and energy require attenuation using an ND filter or the like.
For example, the CA50-NCG sensor saturates at an intensity of about 1 uW/cm2.
For a Class 2 (1mW) laser with a beam diameter of 2mm, the light intensity is estimated to be about 30mW/cm2, requiring attenuation of 4 to 5 orders of magnitude with an ND filter.
Our ND filter set includes several filters. Multiple filters can be used in combination.
Note that for 100 mW or more, attenuation must also be combined with a beam splitter because ND filters cause thermal lensing effects.
If you are looking for a beam profiler that enables measurement simply by inputting a laser beam without using attenuation optics, please use our beam profiler for large apertures and high power (LaseView-LHB).
Q4: Is it possible to use it as a power meter?
The CCD has a function to display the relative total power integrated over the entire beam, but it is not calibrated in absolute terms and cannot measure the absolute power because the sensitivity of the CCD and the amount of dark current depend on temperature.
It is possible to remove the temperature dependency by using a cooled CCD (with temperature control). However, the dynamic range of CCDs is about three digits, so the upper limit of the dynamic range for power measurement is about 1000 counts.
Q5: Is a CMOS camera inferior to a CCD camera?
Compared to CCD sensors, CMOS sensors have
・Higher fixed pattern noise.
・Sensitivity uniformity and Linearity are inferior.
However, the latest CMOS sensors have solved these problems and can provide characteristics comparable to CCD sensors.
On the other hand, CMOS sensors are superior to CCD sensors in the following areas
・High readout speed (frame rate)
・Low power consumption
・Smaller substrate area
・Low cost.
Please contact us if you have any questions about CMOS cameras or CCD cameras.
Q6: Is there a difference between color and monochrome?
In general, it is not recommended to use a color camera for quantitative beam measurements. The disadvantages of using a color sensor are as follows:
1. low sensitivity, which can be as low as 1/100 or less, especially in the infrared range, due to the built-in IR cut filter
2. lower measurement accuracy when the beam diameter is small, due to the reduced amount of information.
3. LaseView creates a monochrome image from the average of the three RGB color signals, and displays and analyzes that image, resulting in a narrow dynamic range.
4. signal saturation may be difficult to identify and linearity may be significantly reduced.
Q7: Is it possible to update LaseView after purchase?
Updates are available free of charge for one year after purchase.
Q8: Is it possible to add functions?
Customization is available upon request. Please contact us for details and costs.
Q9: Are there any differences from LaseView 3 (previous versions)?
The following features have been added.
(1) M2 Analysis function
(2) Automatic peak following function based on center calculation
(3) Improved usability
(4) More cameras supported (Imaging Source, iDS, Basler, Artray)
(5) Improved stability
(6) Improved processing speed by parallel computing
(7) Japanese language support
Q10: Is it possible to run two screens at the same time?
LaseView does not have any limitations. However, due to hardware limitations, two cameras may conflict with each other and fail to work. So PC with multiple USB controllers is less likely to have conflict issues.
Q11: Is it possible to subtract the background
The background can be subtracted by using the dark correction function.
Q12: Is it possible to use all the pixels of the camera?
It depends on the specifications of the camera. The software can support any resolution.
Q13: Is it possible to record the edges of past beams to see the beam misalignment?
If the ” Fix Position” option is turned on in the line profile analysis or peak integration analysis, the position of the crosshairs will be retained even after the software is closed.
Q14: Is it possible to measure the center ?
Yes, we can.
Q15: Is it possible to measure the integral value of power?
It is possible to measure the integral value with the peak integration function.
Q16: Is it possible to move the plot position by one pixel at a time?
It is possible by using the mouse.
Q17: Is it possible to specify the coordinates?
The coordinates of the specified position will be displayed by mouse operation, so it’ s possible to adjust to the desired coordinates while viewing the coordinates.
Q18: Is it possible to export the analysis results?
Yes, it is possible to export the results from the menu
File -> Options -> Save Graph Data.
Q19: Is it possible to export images?
In addition to saving screenshots, it is possible to export images including analysis results.
Q20: Is it possible to use it for fluorescence observation?
Yes, it can be used for fluorescence observation of fluorescent materials. However, if the fluorescence of the material is extremely weak, the sensitivity of the camera may be insufficient and measurement may not be possible.
Q21: Is the gamma value corrected?
Some cameras have an adjustable gamma value, but basically the default gamma value is 1.0, which ensures linearity.
In our recommended cameras, the stored electrons of the CCD are amplified by a linear amplifier, so good linearity can be obtained without gamma correction.
If you need more precise linearity correction, please contact us.
Q22: "What is the accuracy of beam diameter measurements? What is the guaranteed accuracy of the beam size range?"
LaseView can perform beam size analysis based on Gaussian fitting. The typical standard error of Gaussian fitting is less than 1% when the measurement is performed under proper conditions with low noise. However, the error can vary greatly depending on the measurement conditions (noise level, beam diameter, and beam shape). For a Gaussian profile, high accuracy can be obtained if the full width at half maximum of the beam is approximately 30 times larger than the pixel size of the sensor and less than a quarter of the photosensitive area of the sensor.
Q23: Regarding the LaseView LHB, what are the disadvantages of increasing the measurement area?
The optical resolution becomes worse in proportion to the photosensitive area size, as shown below.
Photocathode width Approximate optical resolution
10 to 20 mm Approx. 25 μm
20 to 40 mm Approx. 50 μm
40 to 80 mm Approx. 100 μm (standard)
80 mm or more Approx. 200 μm
Q24: Tell how to use D4σ.
The threshold value varies from 0 to 100%, where 0% indicates the background and 100% indicates the top of the beam. Normally, there is no problem with the threshold off.
Q25: The D4σ beam diameter is different from the apparent beam diameter.
The beam diameter is defined as four times the D4σ standard deviation, so a beam with a large base component will have a larger diameter than it appears.
Q26: Is baseline subtraction (background subtraction) necessary for D4σ measurement?
Normally, there is no need to use the background subtraction function for D4σ measurement. The software automatically calculates and subtracts the background level when calculating D4σ.
The background subtraction function is effective for improving accuracy when the CCD camera is not exposed to any light and the background level is not flat. When the background subtraction is turned on and the “Set” button is clicked with no light entering the CCD camera, the image at that time is stored internally as the background level, and the background subtraction process is performed from the next image.
If there is a lot of noise, you can get better results by enabling “Averaging” when you click “Set”.
Q27: Does D4σ mean that the diameter is the ±2σ part centered on the center of gravity?
The standard deviation σ in the horizontal and vertical directions is calculated with the center as the mean value, and 4σ is used as the beam diameter.
Q28: When measuring with D4σ, the range automatically changes depending on the beam size. What kind of calculation is used to change the range?
Based on the beam diameter, the integration range is automatically set. Specifically, it calculates the center and standard deviation σ of pixels with a luminance of 50% or more of the peak luminance, and multiplies σ by an appropriate coefficient to set the width. When “Specify range” is turned on, the integration range can be set manually.
If the integration range is too small, the beam diameter will be evaluated as small, and if it is too large, the error due to background will be large. Also, images with low signal-to-noise ratio will have low accuracy.
The advantage of D4σ is that the beam width can be defined for beams of any intensity distribution. However, the disadvantage of D4σ is that the measurement error increases depending on the measurement conditions because of the integral calculation.
Q29: What is the role of the switch on the side of the profiler?
ON/OFF switch for the screen oscillation motor for speckle reduction. Turning the motor ON and the software "averaging" ON will reduce speckle noise. Note that if the motor is not used, there is no need to connect the AC adapter.
When measuring a laser beam with a narrow line width, speckle noise may occur in the beam profile. When measuring narrow linewidth laser beams, speckle noise may occur in the beam profile. Speckle noise can be reduced by oscillating the screen and performing averaging processing using software. speckle noise can be reduced by oscillating the screen and performing averaging by software. (For low interference light sources such as LEDs, speckle noise does not occur. (For low-interference light sources such as LEDs, speckle noise is not generated, so there is no need to use this function.)
Q30: When the switch on the side wall of the profiler is turned upward, there is a shuffling sound, is this normal?
The sound is normal. It is the gear noise of the internal motor.
Q31: In the toolbar of the software, there are buttons for “Stop” and “Disconnect”, etc. What is the procedure for shutting down the software?
There is no specific procedure. No matter what you do, the program will automatically take the appropriate action.
For example, there is no problem if you close the application or disconnect the USB while it is being displayed.
Q32: "I would like to measure the beam profile and divergence angle. Is “Line Profile” the best analysis mode for this, or “Integral Profile” if the profile is violent?"
If the profile is violent, the “Averaging” function is suitable.
You can also analyze the beam divergence angle of the saved images by clicking [Folder] -> [Batch Analysis].
Q33: In LasaView, if I basically save the image as “Save Image” – “*.tif”, I can later open the image and analyze it for FWHM, etc., and also export it to csv?
Exactly.
Q34: "About “Save the numerical data of the graph”, when saving the csv “Hori.i:Y” is the profile of the horizontal direction of the crosshairs, right? “Ver.Y” is the vertical profile of the crosshairs, right?"
Exactly.
Q35: "About “Save the numerical data of the graph” Is there a way to save a profile of any cross section? Is there any way to save a 3D (full) profile?"
To save the profile of an arbitrary cross section, select “Line Profile” in Analysis and move the crosshairs to the desired position with the mouse.
The numerical data of all pixels can be saved from [File]->[Export Image]->[CSV Text].
Q36: Is the pixel size still the “default” setting?
In LaseView-LHB, the “default” pixel size is set to 40 x 40µm (62.5 x 62.5µm in LHB-100).
The pixel size has been calibrated and should normally be left unchanged.
If the pixel size display at the bottom of the window shows (not set), the LHB driver may not have been installed properly.
Q37: "In the csv that I saved by selecting “Line Profile” and then “Save Graph Data”, there are columns named “Fit Hori. X/Y” and “Fit Vert.X/Y” What does this mean? Also, in other modes, are there other columns added?"
When you select a Gauss fit in the analysis, a graph in red will appear on the screen, and Fit Hori. X/Y are the numerical data of the red line.
Q38: Tell about the linearity of the measured light intensity.
It depends on the performance and specifications of the camera used, but recent camera products do not seem to cause any major problems when the gamma value is set to 1 (or when it can be set).
The camera (LaseView-CA50-NCG) has been confirmed to provide a linear response, but the linearity value cannot be guaranteed. Note that the linearity may vary depending on the camera settings (gain and exposure time).
Q39: Is there any information on spectral response (300 nm and below)?
There is no data on spectral response below 300 nm. It has been confirmed that the excimer laser has sensitivity up to 193 nm, but the sensitivity below 300 nm is one to three orders of magnitude lower than the visible range.
Q40: Is Internet connection required for LaseView license activation?
Internet connection is required only for activation during installation.
Q41: "Tell about the resolution of the LHB series. In the catalog, the resolution is 100um, so I assumed that one pixel output in csv is 100um. Is this a correct understanding?"
The optical resolution of 100um in the catalog value refers to the resolution of the internal optical system, which is larger than the size of a single pixel. The size of a pixel is the width of the light receiving surface divided by the number of pixels in the acquired image: 50 mm / 1250 = 40 µm.
The size of a pixel is displayed in the status bar of the screen as pixel size.
Q42: In the device selection, there are two options, DirectShow and ImagingSource, do they have different functions and performance?
Normally, please use ImagingSource.
DirectShow can only acquire 8-bit images by default.
ImagingSource can acquire 12-bit images.
There are also some differences, such as the exposure time being displayed in real time.
Q43: "The minimum output power of the laser is 30W, and even if I change the exposure or gain, the sensor is instantly saturated. Also, the light spreads out horizontally and the intensity distribution cannot be measured. Is it difficult to measure this kind of laser light with the standard specification of LHB-100?"
If the image is saturated even when the gain and exposure time are minimized, the only option is to reduce the light intensity. The light intensity can be reduced by a factor of 10 to 100 by introducing the reflected light from the wedge plate or transmitted light from the HR mirror into the LHB. When purchasing, it is possible to reduce the sensitivity by incorporating a higher density ND filter. Also, the symptom of horizontal lines appearing is a phenomenon called smear, which occurs when strong light enters the camera.
Q44: The new OAS-CA50-100 combines two beam splitters to increase attenuation, but is it possible to remove one beam splitter and use it like the OAS-CA50?
One beam splitter can be removed. In the case of the OAS-CA50-100, two beamsplitters can cancel out polarization dependence, making it polarization independent.
Q45: Is it correct to place an ND filter between the light source (laser beam) and the camera as a way of attenuating the CA50-NCG by myself?The power is 100W
Since ND filters cannot withstand high output light, a high output-compatible attenuator is required before the ND filter. It is common to use transmitted light from a high-reflection mirror or reflected light from a low-reflection beamsplitter for measurement.
Q46: What happens when a beam smaller than the optical resolution is injected?
When the optical resolution is 100 μm, an incident beam smaller than this produces a point spread function equivalent to 2 to 3 pixels as shown in the attached figure, and this width is used as the optical resolution. The optical resolution is determined by the performance of the lens optics between the sensor and the light-receiving part.
Q47: Regarding LHB, I understand that the data output in CSV data is 1440 x 1080, which is the number of effective pixels of the sensor.
The number of pixels acquired is 1600 x 1600 pixels, corresponding to a screen center of 50mm x 50mm. Therefore, the pixel pitch is 31.25μm.
Q48: Is the bit depth of the power density 16 bits?
You can switch between 8-bit and 16-bit on the software. [The switch can be made in the CAMERA tab, under CAMERA SETTINGS, and then under Pixel Format.
Q49: How will the measurement range be set and determined?
Light intensity and image luminance signal are proportional, but the physical quantity of light intensity and the signal quantity are not calibrated. Sensitivity varies depending on the camera gain and exposure time settings.
Q50: "Regarding LaseView-CA50-NCG, please let us know: ・Frame rate ・Detection limit intensity (saturation intensity (W/cm2) ・Minimum detectable intensity (W/cm2)"
The following is a description of LaseView-CA50-NCG.
・Frame rate: up to 12 fps
・Saturation intensity (W/cm2): 1 to 10 μW/cm2 (approximate at 1 ms exposure time)
・Minimum detectable intensity (W/cm2): 0.01 to 0.1 μW/cm2 (as a guide when exposure time is 80 ms)
*Saturation intensity and detection sensitivity depend on wavelength.
・Exposure time setting range: 17 μs to 80 ms
Q51: Regarding LHB-200, I would like to know the size in real space per cell. 200mm/2500 cells = 80μm, is that correct? I am concerned because the above value is smaller than the resolution in the catalog specs. Also, is it possible to check the pixel size on LaseView?
That is correct. The resolution in the catalog specifications refers to the optical resolution, which indicates the degree of blur when observing a tiny spot. Therefore, the resolution is a large value compared to the pixel size. Pixel size is displayed at the bottom of the screen (see the figure below).
Q52: "With respect to the LHB series, do you know the fill factor of this sensor? We are considering to estimate the peak power density by analyzing the power measured separately and the counts of the profile acquired by this sensor. After converting the counts to power, we believe that a fill factor is needed to convert the counts to density by dividing by pixel size."
The fill factor of the sensor is unknown as it has not been published by the manufacturer. Since the fill factor per pixel is a constant value, the power density can be estimated even if the fill factor is unknown. Using “peak-integral” analysis, the power density can be easily estimated. Multiply this value by the incident laser power to obtain the power density in W/cm2. This value is only an estimate. Please note that the accuracy may decrease depending on the situation.
Q53: When the laser beam spot is elliptical, is it possible to automatically select and measure the length of the major and minor axes?
It is possible to measure the width of the major and minor axes of an ellipse, but the tilt of the axes must be set manually (mouse operation).
Q54: When a laser spot has a distorted shape, is it possible to obtain cross-sectional information at a specified position?
When the intensity distribution is distorted, it is possible to evaluate the beam diameter using analysis methods such as D4σ.
Q55: About the light intensity distribution of spot light, is it possible to change the cross-sectional position of light intensity distribution to a different position later?
A Two-dimensional intensity distribution can be acquired and saved as an image. One-dimensional intensity distribution on any line on the two-dimensional image can be displayed. The position of the line can be changed by mouse operation.
Q56: "When the light intensity of a light source is unstable, Is it possible to average the light by integration, etc.? Is it possible to adjust the amount of averaging?"
The latest multiple images are always buffered.
There is a mode that displays an averaged image of the images in the buffer in real time.
The buffer length (number of images to be averaged) can be changed to any number.
Q57: "About beam splitters, is it possible to disclose the structure inside? Is there a structure that can contain a bandpass?Can the amount of light attenuation be quantified?"
An uncoated wedge plate (beamsplitter) is used to reflect light at an angle of incidence of 45 degrees.
After reflection, the light is attenuated by an ND filter.
If the direction of polarization and wavelength are known, the reflectance of the beamsplitter can be calculated.
Since there are individual differences in the transmittance of ND filters, measurement is required for accurate quantification.
Q58: Regarding the output format of light source information, is it possible to save it in a format that can be imported into ZEMAX, LT, etc.?
The acquired images are saved in TIFF or CSV format. ZEMAX and other formats are not supported.
Q59: Which values of the multiple image files are specifically read and calculated? Please also tell us the calculation formula for this. Also, what information does the green dotted line indicate when the beam is surrounded by a green dotted line when using the beam diameter and centre of gravity in the analysis?
If 'Second Moment (D4σ)' is selected under 'Method', half (radius) of the D4σ X and D4σ Y values of the 'Beam diameter and centre of gravity' analysis are displayed.
If 'Gaussian Fitting (1/e2)' is selected, half of the FW@1/e2 X and FW@1/e2 Y values of the 'Line profile (Gauss)' analysis are displayed.
The green dotted line also indicates the integration range. By restricting the integration range to an appropriate range, the accuracy of the calculation is prevented from deteriorating.For more information on D4σ and 1/e2 widths, please see the following website.
https://en.symphotony.com/products/laseview/principle/diameter/
Q60: As a general question, does the wavelength of the light source used in the measurement affect the measurement data and calculation results?
Measurement results are not affected by wavelength. However, the beam quality (M2) measurement is wavelength dependent, so please enter the wavelength.
Q61: Is it difficult to measure the divergence angle for a single image (without data in buffer)?
If the position of the beam waist (fiber end) of the light source is known, the divergence angle can be calculated from the beam width of a single image. The formula is as follows:
Beam divergence angle = beam radius / distance from beam waist to sensor
Q62: Also, the data calculated by increasing the number of measurement points is shown as an approximate straight line, but is there any possibility that it is inherently non-linear? Also, when measuring the divergence angle of a fiber, is there any difference between the results at a long distance and at a short distance (e.g., multiple points at a long distance are more accurate)? (e.g., multiple points at a long distance are more accurate).
In general, if the beam divergence angle is large and far from the beam waist, it will asymptotically approach a straight line. To measure near the beam waist, use the beam quality (M2) measurement function. However, this does not apply if the beam shape varies with position (no Gaussian beam). When measuring multiple images, the greater the change in beam diameter, the greater the accuracy. In other words, the larger the distance, the more accurate the measurement. If the beam shape varies with position (no Gaussian beam), the results at far and near distances may differ significantly.
Q63: Is your method of calculating M2 in line with ISO 11146? Please tell us how you calculate M2.
Yes, LaseView performs the analysis in a manner consistent with ISO 11146. It automatically analyzes images at multiple locations near the beam waist and calculates the secondary moment width (D4σ) at each location. The curve of the variation of the secondary moment width is fitted by the least-squares method to calculate M2, beam waist diameter, beam divergence angle, etc. It is not compliant with ISO11146-2, but calculates the secondary moment width of the ISO11146-1 power density distribution. In principle, it would be difficult to measure the Wigner distribution function specified in ISO11146-2 using only a standard beam profiler.
Q64: If you change the gain, etc., I believe the beam diameter will also change. If we change the laser incident power, we would need to adjust the gain, exposure, etc. Is there any way to accurately measure the beam diameter when changing the laser power?
For more accurate measurements, please pay attention to the “black level” setting. The dark purple area on the screen indicates that the signal is below 0. In this case, the background level is clipped at 0, resulting in a smaller beam diameter analysis result than actual. In the “Camera” tab, select “Others” > “Black Level” and increase the value of the black level until the dark purple area disappears. It is inevitable that there will be some errors in the analysis results depending on the gain, exposure time, and light level. To reduce noise, set the gain to the minimum (0). Also, increase the light level or exposure time to increase the signal level to the point where it does not saturate, and perform the measurement with a high signal-to-noise ratio. Averaging multiple images using the “Averaging” function may reduce noise.
Q65: Multiple beams with intensity differences of about several uW~ several mW are simultaneously injected into the LHB without ND filter. If I set the exposure time so that the maximum intensity beam is not saturated, I cannot acquire a weak intensity beam, and if I adjust the exposure time so that the weak beam is acquired, the maximum intensity beam is saturated. I would like to know if there is a way to measure this successfully.
It is not possible to measure spots of widely differing intensity simultaneously. This is because the dynamic range of the camera is only about 2.5 digits (about 300:1).
There are two ways to measure the intensity of a spot.
1. Separate measurement of strong and weak spots at two separate times.
In this case, the exposure time, etc., is fixed and measurement is performed with and without an ND filter of known transmittance, and the intensity can be converted after measurement to compare the intensity of the strong and weak spots.
2. Insert an ND filter of known transmittance only in the strong beam area. In this case, only one measurement is needed. A small size ND filter is required.
Q66: We would like to operate with several GigE cameras, but trigger operation causes the camera to stop working after about 3 cameras. We see on the website that there is an option for USB cameras and we think it works with 4 cameras, etc. Is a USB connected camera better?
When multiple GigE cameras are connected using a hub, bandwidth may be insufficient. You may need to reduce the frame rate to reduce the amount of data, or add multiple Ethernet boards to the PC to secure bandwidth. Enabling jumbo packets may also help. Ideally, there should be one camera per Ethernet controller; there are boards on the market that have independent 4-port controllers on a single board.
Q67: What are the quality check criteria and check methods for trapezoidal correction of LHB? Regarding trapezoidal correction, up to how many pixels difference is the specification when looking at the corners?
The LHB is moved vertically and horizontally on a calibrated precision motorized stage, and the spatial distortion of the entire photosensitive area is measured by calculating the difference between the center of gravity of the laser beam measured by the LHB and the actual position at 10 x 10 points (100 points) on a grid. Calibration data is created based on these measured values, and the distortion is corrected by software. This distortion correction is enabled by installing the LHB Driver with the same serial number.
For example, in the case of LHB-100, 1 pixel is 62.5um, so the linearity error is within 300um/62.5um = 4.8 pixels.
Q68: What is the "position linearity error" in the LHB test report?
The "position linearity error" in the test report is a value representing the amount of spatial distortion of the instrument. The position linearity error is measured by moving the main unit of the LHB on a calibrated motorized stage and calculating the difference between the center of gravity of the laser beam measured by the LHB at each position and the actual position.
The definition of position linearity error is the same as that of linearity in the following site.
https://www3.panasonic.biz/ac/e/service/tech_support/fasys/glossary/measurement/002/index.jsp
Q69: We are considering LHB. Is it safe to measure by sticking the luminous surface of the product to the screen to reduce the spread of light?
If the screen is not burnt by light exposure, sticking is not a problem.
Q70: How is the order of the files determined when a folder is imported? Is it necessary to manually sort the output CSV results?
When a folder is opened, the order of files is sorted by modification date.
Usually, the order is the order in which the files were saved.
Q71: The logging interval for image logging, can it be less than 1 second (e.g. 0.1 second)?
This is not possible. If the interval is too short, the file saving process will not be completed in time.
As an alternative, set the "Frame Rate" to 10 (Hz) in the "Camera" tab > "Camera Control" > "Others" and save the images stored in the buffer to save images at intervals of 1 second or less.
Q72: Regarding averaging, when averaging is checked, does it average the intensity of each pixel in the most recently captured image for the number of images set by the buffer length? What is the maximum buffer length that can be set?
That is correct. Changing the buffer length changes the number of images to be averaged. There is no upper limit to the buffer length. The upper limit is determined by the memory capacity of the PC. Please note that very large buffer lengths may cause OS instability.
Q73: Am I correct in thinking that the length of averaging depends on the exposure time set by the camera control? For example, if the exposure time is 1ms and the buffer length is 100, does this mean that the averaging will be for the last 100ms?
The interval at which images are captured from the camera depends on the "Frame Rate" setting. For example, a frame rate of 10 Hz and a buffer length of 100 results in an average of 10 seconds.
Q74:If "Save all images in buffer" is selected for image logging, will 100 images be saved before averaging if the buffer length is 100?
That's right: 100 images are stored in a single file (multipage TIFF).
Q75 : I am considering LHB-200 and LHB-100 to check the profile of a laser for a processing application. The wavelength is 940-1064nm, so I think it is OK, but the incident power is 500W to 1kW continuous light.
Standard products can be used by either of the following methods.
(1) Attenuate the incident light to an average of 10W or less.
(2) Shorten the time of laser incidence.
With the standard specifications, the maximum incident light intensity is 10W at continuous incidence. Due to the heat resistance limitation of the screen, the light intensity of the incident light should also not exceed 100 W/cm2. It is possible to input more than 1 kW for a short time as long as the temperature of the main unit of the measuring instrument does not exceed 40°C. As a rough guide, 1 kW can be input for a maximum of 10 seconds when the room temperature is 25°C with LHB-100. 500 W can be input for a maximum of 20 seconds. However, the temperature of the enclosure will rise due to the injection, and you will need to wait until the temperature of the unit cools down before taking the next measurement.
Q76 :I am going to dispose of the PC on which LaseView was installed and would like to use the license on another PC.
Open LaseView on the currently installed PC and select the Help tab. Click on the icon labeled "Product Information" in the upper left corner. The "Product Information" window will open as shown in the figure below. In the lower left corner of the window, there is a button that says "Deactivate License Activation. Clicking this button will bring up a window asking whether you want to "Deactivate License Activation" or not, as shown in the figure below (*). If you click "Deactivate" here, the license will be deactivated and you can use it on the new PC. There is no need to uninstall LaseView. When you start LaseView on the original PC, you will be prompted to enter your license.
For example, if you want to use LaseView on multiple PCs in the lab, you can deactivate it in the lab and then activate it in the lab. If the PC on which the license is being activated is broken and cannot be started, please contact us. We will deactivate the license.
(*) https://www.symphotony.com/wp-content/uploads/license_revoke.png
Q77 :My camera does not support DirectShow, is there a way to use it with LaseView?
If we create a custom driver, you can use it with LaseView. We have many experiences.
The following two conditions are required.
1) The camera must be provided to us at least for two weeks.
2) The camera manufacturer must provide an SDK (Software Development Kit).
The delivery period is 2 weeks after receipt of the camera and the cost will be quoted on a case-by-case basis.
Q78: I clicked on the LaseView download link but could not open it with an error.
For evaluation licenses, the link cannot be opened once it expires. Please contact us again.
Q79: I am using LHB-100. Stray light is very strong and affects the acquisition of profiles in the XY direction. I understand that stray light occurs at an incident angle of ±15deg or more. Also, how is the angular resolution calculated by setting the distance between the screen and the light source? Is it correct to assume that the angular resolution increases as the distance increases? For example, when we calculated the angular resolution at a distance of 20mm, we got a value of 0.18deg per pixel near the center.
Reducing stray light deteriorates resolution. We are considering developing a product that reduces stray light. The specification is that the angular resolution is 3.3 deg for a full angle of 160 deg.
The distance between the screen and the light source is 8.8mm. The angular resolution increases as the distance is increased.
In the case of LHB-100, the spatial size of one pixel is 50μm, but the resolution of the optical system is about 200μm, meaning that the image will be blurred by this degree. At a distance of 20mm, the optical resolution would be 0.57deg.
Q80: When I look at an image in Windows Paint that looked good in LaseView, it is black. When I reopen it in LaseView, it looks clean. It seems to be saving correctly, but is there any way to make it visible in Explorer? Also, the file size was initially about 2.2 MB per file, but now I see it is about 20 MB. Is this possible?
If the bit number is set to 8bit in "Camera" -> "Camera Settings" -> "Pixel Format", the image will be saved as an 8bit image and will not be black in Explorer, etc.
If "Save all images in buffer" is checked, multiple images will be saved in one file, resulting in a larger file size. In this case, the file format is called multipage TIFF. Even if "Save all images in buffer" is checked, thumbnails will still be displayed if the image is an 8-bit image.
Q81: I have a question about the MIR series of LaseView camera sets. What is the detection method of the sensor, the time constant and the upper limit of the incident light level?
Details cannot be disclosed, but the sensor is a microbolometer. The IntegrationTime of this detector is fixed and is 50 µsec. The thermal time constant is 10-30 ms. It is equivalent for all models. The upper limit of the incident light intensity cannot be determined as no destructive testing has been carried out, but in past experience, the element has been damaged in approximately several msec to 10 msec. Basically, detection is sufficient in the order of µsec.
Q82: When the sensor (CA50-NCG) is not lit, the LaseView screen is When the sensor (CA50-NCG) is not illuminated, the LaseView screen shows a large number of horizontal stripes, which remain in the background even when the light is switched on. Is there any way to improve this?
If the amount of incident light is low with 'Auto Range' ON, the fixed pattern noise of the sensor becomes more noticeable. Also, if the 'Gain' is increased, the noise will increase. Fix the gain at around 400 and adjust the incident light level and exposure time to obtain good S/N.
Due to the characteristics of the camera, setting the gain to a small value for the CA50-NCG will cause the sensor to saturate before the A/D converter saturates. To maximise the dynamic range, we recommend measuring with a gain of around 400.
If 'AutoRange' is on, please switch 'Home' → 'AutoRange' off and press 'Reset' next to it.
After that, please make sure that sufficient light is incident to the sensor to prevent it from being saturated, and perform the measurement.
If the fixed pattern noise of the sensor bothers you, use the background subtraction function.
Turn on [Home] → [BG subtraction] and press [Set] with no light entering the camera.
The image at the time of pressing [Set] is stored and subtracted from subsequent images to flatten the background.
Q83: In some cases the exposure time/gain is displayed as Auto. Why is this? In the case of Auto, there was no change. If it was set to a numerical value, it could be adjusted by moving the slide left or right.
The camera's default value is set to Auto, so it may become Auto the first time it is connected. By moving the slide to the left or right, the value will be set and the camera will not be in Auto the next time. Do not normally use the camera in the Auto state.
Q84: I would like to know about the software LaseView, can I also extract RAW data from the camera with this software? Or can RAW data be extracted without using LaseView?
There is no function to save images in RAW format. However, TIFF format files saved by LaseView contain uncompressed image data equivalent to RAW data. The system also supports saving files in CSV format (text format), which allows the raw data to be displayed in Excel and other applications.
Q85:The CA50-NCG-BE is used to measure beam diameters of around 5 µm. When the beam profiler is moved back and forth from the spot position to measure the beam shape, the beam shape is not targeted and appears slightly distorted. Please explain why the shape is different when moving away from the spot position.
The beam pattern before and after focus can vary significantly, affected by slight wavefront distortions of the light source. In addition, the pre- and post-focus beam patterns are generally different. There are only a few exceptions: as an example, in an ideal Gaussian beam, the beam pattern does not change at and around the focal point and is always a Gaussian function. Conversely, if there is even a small amount of wavefront distortion or if the intensity distribution is not Gaussian, the beam pattern before and after the focus will not be identical. This is because the beam pattern changes according to the Fresnel diffraction equation.
https://ja.wikipedia.org/wiki/%E3%83%95%E3%83%AC%E3%83%8D%E3%83%AB%E5%9B%9E%E6%8A%98